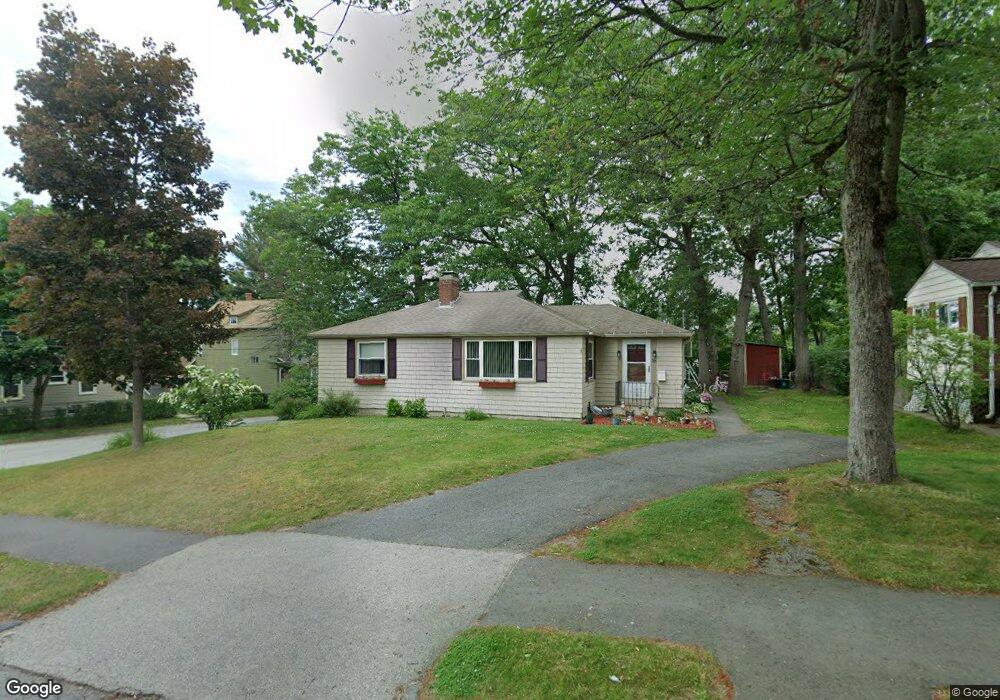
16 Ball St Worcester, MA 01603
Webster Square NeighborhoodEstimated Value: $374,000 - $428,000
3
Beds
2
Baths
1,074
Sq Ft
$375/Sq Ft
Est. Value
About This Home
This home is located at 16 Ball St, Worcester, MA 01603 and is currently estimated at $403,113, approximately $375 per square foot. 16 Ball St is a home located in Worcester County with nearby schools including Gates Lane, Jacob Hiatt Magnet School, and Chandler Magnet.
Ownership History
Date
Name
Owned For
Owner Type
Purchase Details
Closed on
Aug 26, 2024
Sold by
Brandli Mark W and Brandli Leslie A
Bought by
Nakollari Stefan
Current Estimated Value
Purchase Details
Closed on
Jun 14, 1989
Sold by
Gannon Robert
Bought by
Marshall John F
Purchase Details
Closed on
Jan 12, 1989
Sold by
Goldman David N
Bought by
Gannon Robert D
Create a Home Valuation Report for This Property
The Home Valuation Report is an in-depth analysis detailing your home's value as well as a comparison with similar homes in the area
Home Values in the Area
Average Home Value in this Area
Purchase History
| Date | Buyer | Sale Price | Title Company |
|---|---|---|---|
| Nakollari Stefan | $2,300 | None Available | |
| Nakollari Stefan | $2,300 | None Available | |
| Nakollari Stefan | $2,300 | None Available | |
| Marshall John F | $109,000 | -- | |
| Gannon Robert D | $92,585 | -- | |
| Marshall John F | $109,000 | -- | |
| Gannon Robert D | $92,585 | -- |
Source: Public Records
Mortgage History
| Date | Status | Borrower | Loan Amount |
|---|---|---|---|
| Previous Owner | Gannon Robert D | $25,000 | |
| Previous Owner | Gannon Robert D | $128,000 | |
| Previous Owner | Gannon Robert D | $122,887 |
Source: Public Records
Tax History Compared to Growth
Tax History
| Year | Tax Paid | Tax Assessment Tax Assessment Total Assessment is a certain percentage of the fair market value that is determined by local assessors to be the total taxable value of land and additions on the property. | Land | Improvement |
|---|---|---|---|---|
| 2025 | $4,566 | $346,200 | $98,300 | $247,900 |
| 2024 | $4,461 | $324,400 | $98,400 | $226,000 |
| 2023 | $4,328 | $301,800 | $85,500 | $216,300 |
| 2022 | $3,850 | $253,100 | $68,500 | $184,600 |
| 2021 | $3,728 | $229,000 | $54,800 | $174,200 |
| 2020 | $3,565 | $209,700 | $54,400 | $155,300 |
| 2019 | $3,326 | $184,800 | $47,500 | $137,300 |
| 2018 | $3,218 | $170,200 | $47,500 | $122,700 |
| 2017 | $3,271 | $170,200 | $47,500 | $122,700 |
| 2016 | $3,209 | $155,700 | $33,800 | $121,900 |
| 2015 | $3,125 | $155,700 | $33,800 | $121,900 |
| 2014 | $3,042 | $155,700 | $33,800 | $121,900 |
Source: Public Records
Map
Nearby Homes