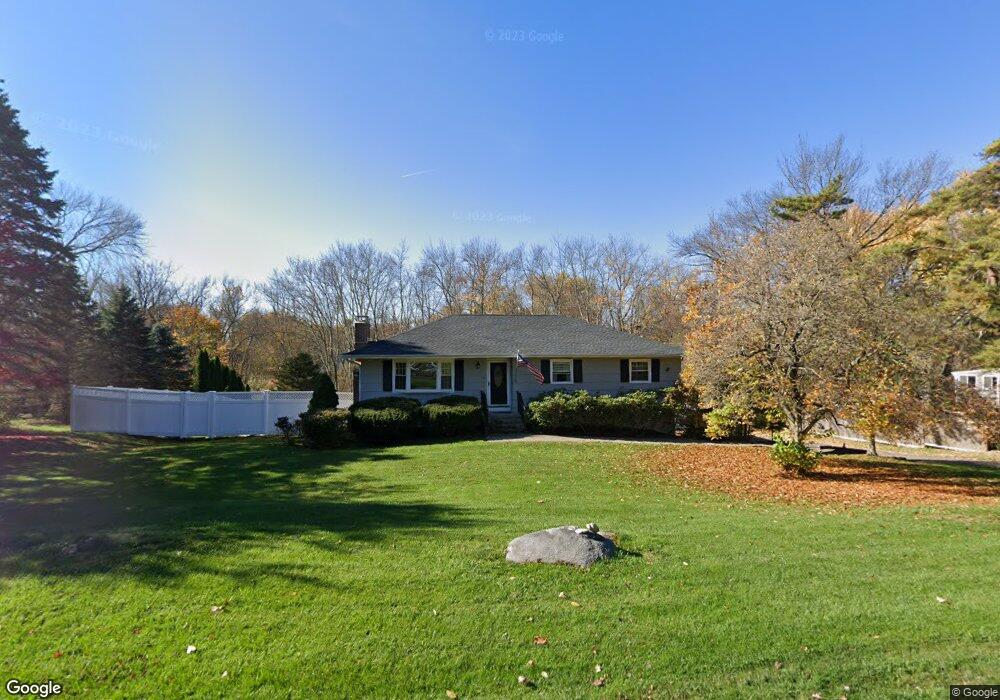
16 Beech Tree Rd Brookfield, CT 06804
Estimated Value: $546,143 - $630,000
3
Beds
3
Baths
1,390
Sq Ft
$412/Sq Ft
Est. Value
About This Home
This home is located at 16 Beech Tree Rd, Brookfield, CT 06804 and is currently estimated at $573,036, approximately $412 per square foot. 16 Beech Tree Rd is a home located in Fairfield County with nearby schools including Whisconier Middle School, Brookfield High School, and Montessori Community School at Brookfield.
Ownership History
Date
Name
Owned For
Owner Type
Purchase Details
Closed on
Oct 24, 2016
Sold by
Wilding Karen
Bought by
Rizk Rizskallah
Current Estimated Value
Home Financials for this Owner
Home Financials are based on the most recent Mortgage that was taken out on this home.
Original Mortgage
$300,000
Outstanding Balance
$240,354
Interest Rate
3.44%
Mortgage Type
Purchase Money Mortgage
Estimated Equity
$332,682
Purchase Details
Closed on
Oct 10, 2014
Sold by
Deaver David G
Bought by
Deaver Karen L
Purchase Details
Closed on
Jul 6, 2005
Sold by
Heelan Samuel and Heelan Diane
Bought by
Deaver David and Deaver Karen
Purchase Details
Closed on
Mar 31, 1997
Sold by
Dillon David T and Dillon Kathleen M
Bought by
Heelan Diane C
Purchase Details
Closed on
May 18, 1987
Sold by
Lo Gerald
Bought by
Dillon David
Create a Home Valuation Report for This Property
The Home Valuation Report is an in-depth analysis detailing your home's value as well as a comparison with similar homes in the area
Home Values in the Area
Average Home Value in this Area
Purchase History
| Date | Buyer | Sale Price | Title Company |
|---|---|---|---|
| Rizk Rizskallah | $325,000 | -- | |
| Rizk Rizskallah | $325,000 | -- | |
| Deaver Karen L | -- | -- | |
| Deaver Karen L | -- | -- | |
| Deaver David | $406,000 | -- | |
| Deaver David | $406,000 | -- | |
| Heelan Diane C | $180,000 | -- | |
| Heelan Diane C | $180,000 | -- | |
| Dillon David | $178,000 | -- |
Source: Public Records
Mortgage History
| Date | Status | Borrower | Loan Amount |
|---|---|---|---|
| Open | Dillon David | $300,000 | |
| Closed | Dillon David | $300,000 |
Source: Public Records
Tax History
| Year | Tax Paid | Tax Assessment Tax Assessment Total Assessment is a certain percentage of the fair market value that is determined by local assessors to be the total taxable value of land and additions on the property. | Land | Improvement |
|---|---|---|---|---|
| 2025 | $7,695 | $265,990 | $83,690 | $182,300 |
| 2024 | $7,421 | $265,990 | $83,690 | $182,300 |
| 2023 | $7,144 | $265,990 | $83,690 | $182,300 |
| 2022 | $6,884 | $265,990 | $83,690 | $182,300 |
| 2021 | $6,255 | $207,820 | $92,990 | $114,830 |
| 2020 | $6,162 | $207,820 | $92,990 | $114,830 |
| 2019 | $6,056 | $207,820 | $92,990 | $114,830 |
| 2018 | $5,890 | $207,820 | $92,990 | $114,830 |
| 2017 | $5,671 | $207,820 | $92,990 | $114,830 |
| 2016 | $5,457 | $206,690 | $101,220 | $105,470 |
| 2015 | $5,312 | $206,690 | $101,220 | $105,470 |
| 2014 | $5,312 | $206,690 | $101,220 | $105,470 |
Source: Public Records
Map
Nearby Homes
- 23 Sunset Hill Rd
- 5 Woodland Hills Terrace
- 112 A Stony Hill Rd
- 29 Ledgewood Dr
- 27 Obtuse Rd S
- 6 Comstock Trail Unit 6
- 1 Essex Ct Unit 1
- 4 Arlington Ct
- 70 Obtuse Hill Rd
- 16 Homestead Ln
- 12 Oak Crest Dr
- 19 A Apache Dr
- 2 Old Grays Bridge Rd
- 95 Obtuse Rd S
- 23 Farrell Rd
- 8 Marilyn Rd
- 16 Farrell Rd
- 99 Obtuse Hill Rd
- 10 Elmwood Ct
- 43 Bramble Way
- 14 Beech Tree Rd
- 18 Beech Tree Rd
- 87 Whisconier Rd
- 85 Whisconier Rd
- 12 Beech Tree Rd
- 20 Beech Tree Rd
- 2 Coach Dr
- 1 Coach Dr
- 13 Beech Tree Rd
- 89 Whisconier Rd
- 11A Beech Tree Rd
- 11 Beech Tree Rd
- 4 Coach Dr
- 10 Beech Tree Rd
- 22 Beech Tree Rd
- 9 Beech Tree Rd
- 9B Beech Tree Rd
- 19 Beech Tree Rd
- 81 Whisconier Rd
- 6 Coach Dr
Your Personal Tour Guide
Ask me questions while you tour the home.