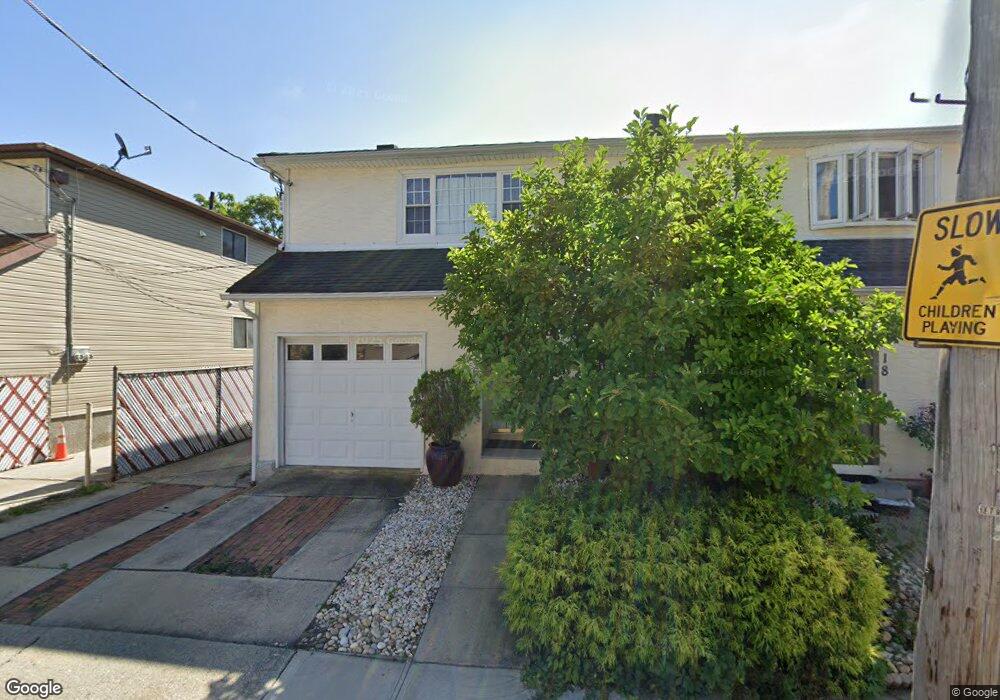
16 Behan Ct Staten Island, NY 10306
New Dorp NeighborhoodEstimated Value: $820,000 - $956,000
5
Beds
2
Baths
1,824
Sq Ft
$485/Sq Ft
Est. Value
About This Home
This home is located at 16 Behan Ct, Staten Island, NY 10306 and is currently estimated at $884,595, approximately $484 per square foot. 16 Behan Ct is a home located in Richmond County with nearby schools including P.S. 41 The Stephanie a Vierno School, Is 2 George L Egbert, and New Dorp High School.
Ownership History
Date
Name
Owned For
Owner Type
Purchase Details
Closed on
May 10, 2017
Sold by
Weiler Matthew C and Weiler Harrict T
Bought by
Weiler Matthew C
Current Estimated Value
Purchase Details
Closed on
Jan 23, 2004
Sold by
Butler Virginia
Bought by
Weiler Matthew C and Weiler Harriet T
Home Financials for this Owner
Home Financials are based on the most recent Mortgage that was taken out on this home.
Original Mortgage
$263,000
Interest Rate
5.75%
Mortgage Type
Purchase Money Mortgage
Purchase Details
Closed on
Jun 10, 1997
Sold by
Butler Roy E and Butler Virginia
Bought by
Butler Virginia
Home Financials for this Owner
Home Financials are based on the most recent Mortgage that was taken out on this home.
Original Mortgage
$63,000
Interest Rate
7.81%
Create a Home Valuation Report for This Property
The Home Valuation Report is an in-depth analysis detailing your home's value as well as a comparison with similar homes in the area
Home Values in the Area
Average Home Value in this Area
Purchase History
| Date | Buyer | Sale Price | Title Company |
|---|---|---|---|
| Weiler Matthew C | -- | The Judicial Title Insurance | |
| Weiler Matthew C | $443,000 | Newell & Talerico | |
| Butler Virginia | $85,000 | -- |
Source: Public Records
Mortgage History
| Date | Status | Borrower | Loan Amount |
|---|---|---|---|
| Previous Owner | Weiler Matthew C | $263,000 | |
| Previous Owner | Butler Virginia | $63,000 |
Source: Public Records
Tax History Compared to Growth
Tax History
| Year | Tax Paid | Tax Assessment Tax Assessment Total Assessment is a certain percentage of the fair market value that is determined by local assessors to be the total taxable value of land and additions on the property. | Land | Improvement |
|---|---|---|---|---|
| 2025 | $6,924 | $51,660 | $6,454 | $45,206 |
| 2024 | $6,924 | $45,840 | $7,219 | $38,621 |
| 2023 | $6,605 | $32,521 | $6,277 | $26,244 |
| 2022 | $6,125 | $40,440 | $9,600 | $30,840 |
| 2021 | $6,091 | $38,520 | $9,600 | $28,920 |
| 2020 | $6,127 | $39,060 | $9,600 | $29,460 |
| 2019 | $6,009 | $40,740 | $9,600 | $31,140 |
| 2018 | $5,525 | $27,101 | $7,476 | $19,625 |
| 2017 | $5,212 | $25,567 | $8,630 | $16,937 |
| 2016 | $4,822 | $24,120 | $9,600 | $14,520 |
| 2015 | $5,032 | $26,220 | $7,980 | $18,240 |
| 2014 | $5,032 | $26,220 | $7,980 | $18,240 |
Source: Public Records
Map
Nearby Homes