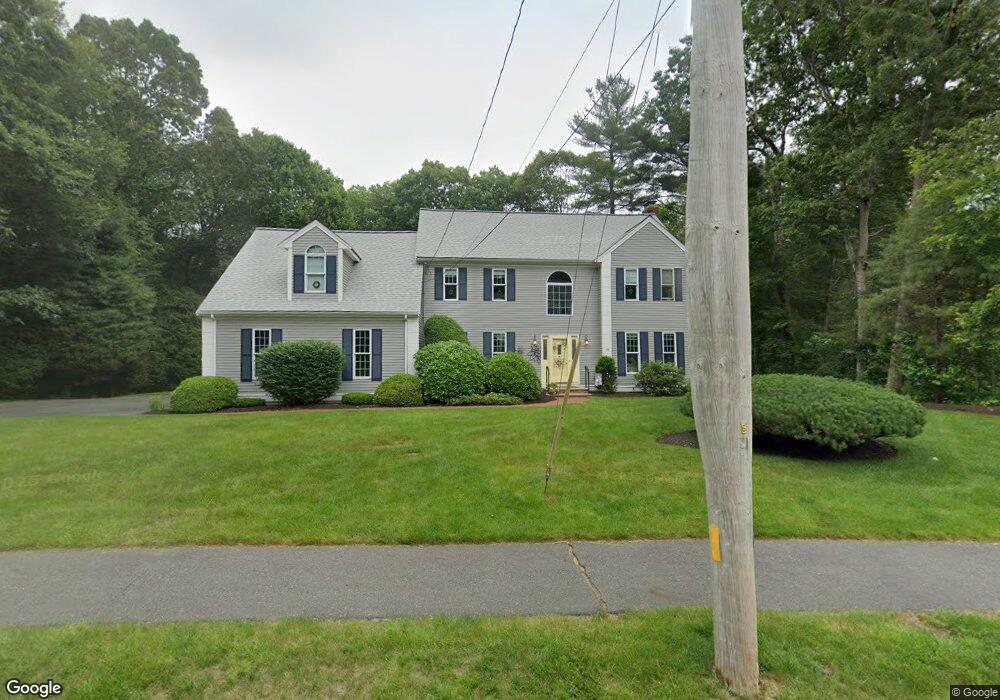
16 Bridle Path Walpole, MA 02081
Estimated Value: $1,145,000 - $1,317,000
4
Beds
3
Baths
3,042
Sq Ft
$403/Sq Ft
Est. Value
About This Home
This home is located at 16 Bridle Path, Walpole, MA 02081 and is currently estimated at $1,225,507, approximately $402 per square foot. 16 Bridle Path is a home located in Norfolk County with nearby schools including Fisher School, Walpole Middle School, and Walpole High School.
Ownership History
Date
Name
Owned For
Owner Type
Purchase Details
Closed on
Jul 12, 2023
Sold by
Keefe Daniel S and Keefe Annette L
Bought by
Daniel S Keefe T S and Daniel Keefe
Current Estimated Value
Purchase Details
Closed on
Nov 25, 1998
Sold by
Hasenjaeger John
Bought by
Keefe Daniel S and Keefe Mary F
Purchase Details
Closed on
Nov 24, 1992
Sold by
Stivaletta Corp
Bought by
Sawyer Denise A
Create a Home Valuation Report for This Property
The Home Valuation Report is an in-depth analysis detailing your home's value as well as a comparison with similar homes in the area
Home Values in the Area
Average Home Value in this Area
Purchase History
| Date | Buyer | Sale Price | Title Company |
|---|---|---|---|
| Daniel S Keefe T S | -- | None Available | |
| Keefe Daniel S | $480,000 | -- | |
| Sawyer Denise A | $204,000 | -- | |
| Sawyer Denise A | $204,000 | -- |
Source: Public Records
Mortgage History
| Date | Status | Borrower | Loan Amount |
|---|---|---|---|
| Previous Owner | Sawyer Denise A | $360,000 | |
| Previous Owner | Sawyer Denise A | $360,000 |
Source: Public Records
Tax History
| Year | Tax Paid | Tax Assessment Tax Assessment Total Assessment is a certain percentage of the fair market value that is determined by local assessors to be the total taxable value of land and additions on the property. | Land | Improvement |
|---|---|---|---|---|
| 2025 | $14,521 | $1,131,800 | $427,700 | $704,100 |
| 2024 | $14,021 | $1,060,600 | $411,500 | $649,100 |
| 2023 | $13,000 | $935,900 | $357,600 | $578,300 |
| 2022 | $11,999 | $829,800 | $331,200 | $498,600 |
| 2021 | $11,808 | $795,700 | $312,700 | $483,000 |
| 2020 | $11,358 | $757,700 | $305,400 | $452,300 |
| 2019 | $10,984 | $727,400 | $293,900 | $433,500 |
| 2018 | $10,924 | $715,400 | $282,400 | $433,000 |
| 2017 | $10,621 | $692,800 | $271,500 | $421,300 |
| 2016 | $10,777 | $692,600 | $290,700 | $401,900 |
| 2015 | $10,638 | $677,600 | $287,300 | $390,300 |
| 2014 | $10,324 | $655,100 | $287,300 | $367,800 |
Source: Public Records
Map
Nearby Homes
Your Personal Tour Guide
Ask me questions while you tour the home.