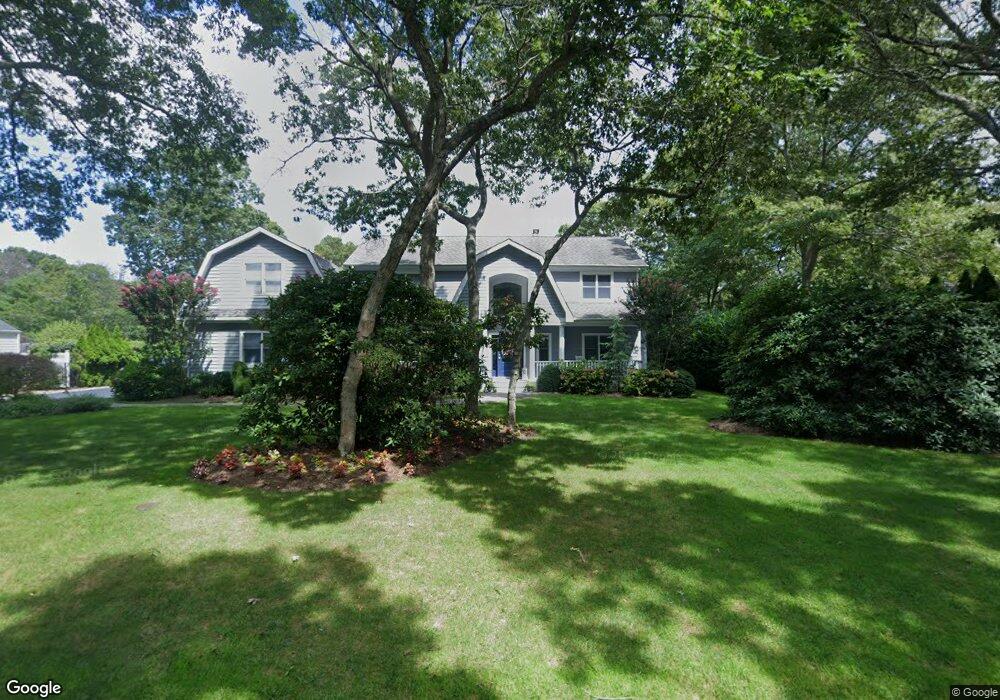
16 Bridle Path Westhampton Beach, NY 11978
Estimated Value: $1,682,000 - $2,235,461
6
Beds
4
Baths
3,000
Sq Ft
$653/Sq Ft
Est. Value
About This Home
This home is located at 16 Bridle Path, Westhampton Beach, NY 11978 and is currently estimated at $1,959,865, approximately $653 per square foot. 16 Bridle Path is a home located in Suffolk County with nearby schools including Westhampton Beach Elementary School, Westhampton Middle School, and Westhampton Beach Senior High School.
Ownership History
Date
Name
Owned For
Owner Type
Purchase Details
Closed on
Jan 30, 2023
Sold by
Mcdonald Anne M
Bought by
Anne Marie Mcdonald Ret and Mcdonald
Current Estimated Value
Purchase Details
Closed on
Sep 15, 2017
Sold by
Milo Sheldon and Milo Trudy
Bought by
Mcdonald David and Mcdonald Anne
Purchase Details
Closed on
May 27, 2005
Sold by
Love Gerard
Bought by
Milo Trudy
Purchase Details
Closed on
Mar 26, 2003
Sold by
Harlen Llc
Bought by
Love Gerard and Love Gina
Home Financials for this Owner
Home Financials are based on the most recent Mortgage that was taken out on this home.
Original Mortgage
$615,000
Interest Rate
5.86%
Mortgage Type
Purchase Money Mortgage
Purchase Details
Closed on
Jun 28, 2001
Sold by
Mckenna Rohna
Bought by
Harlen Llc
Create a Home Valuation Report for This Property
The Home Valuation Report is an in-depth analysis detailing your home's value as well as a comparison with similar homes in the area
Home Values in the Area
Average Home Value in this Area
Purchase History
| Date | Buyer | Sale Price | Title Company |
|---|---|---|---|
| Anne Marie Mcdonald Ret | -- | None Available | |
| Mcdonald Anne M | -- | None Available | |
| Mcdonald David | $1,220,000 | None Available | |
| Milo Trudy | $1,195,000 | Craig Feldherr | |
| Love Gerard | $785,000 | Fidelity National Title | |
| Harlen Llc | $160,000 | -- |
Source: Public Records
Mortgage History
| Date | Status | Borrower | Loan Amount |
|---|---|---|---|
| Previous Owner | Love Gerard | $615,000 |
Source: Public Records
Tax History Compared to Growth
Tax History
| Year | Tax Paid | Tax Assessment Tax Assessment Total Assessment is a certain percentage of the fair market value that is determined by local assessors to be the total taxable value of land and additions on the property. | Land | Improvement |
|---|---|---|---|---|
| 2024 | $6,656 | $1,120,300 | $373,300 | $747,000 |
| 2023 | $11,920 | $1,120,300 | $373,300 | $747,000 |
| 2022 | $3,210 | $1,120,300 | $373,300 | $747,000 |
| 2021 | $3,209 | $1,114,500 | $373,300 | $741,200 |
| 2020 | $11,437 | $1,114,500 | $373,300 | $741,200 |
| 2019 | $11,184 | $0 | $0 | $0 |
| 2018 | -- | $962,700 | $355,500 | $607,200 |
| 2017 | $6,786 | $853,800 | $355,500 | $498,300 |
| 2016 | $6,194 | $768,400 | $320,000 | $448,400 |
| 2015 | -- | $768,400 | $320,000 | $448,400 |
| 2014 | -- | $722,100 | $284,900 | $437,200 |
Source: Public Records
Map
Nearby Homes
- 52 Rogers Ave
- 2 Bridle Path
- 57 Hazelwood Ave
- 49 Bridle Path
- 66 Peters Ln
- 7 Mortimer St
- 30 Brittany Ln Unit 30
- 122 Beach Rd
- 466 Montauk Hwy
- 100 Rogers Ave Unit 701
- 100 Rogers Ave Unit 702
- 100 Rogers Ave Unit 703
- 100 Rogers Ave Unit 101
- 100 Rogers Ave Unit 102
- 100 Rogers Ave Unit 103
- 100 Rogers Ave Unit 201
- 100 Rogers Ave Unit 202
- 100 Rogers Ave Unit 203
- 100 Rogers Ave Unit 601
- 100 Rogers Ave Unit 602