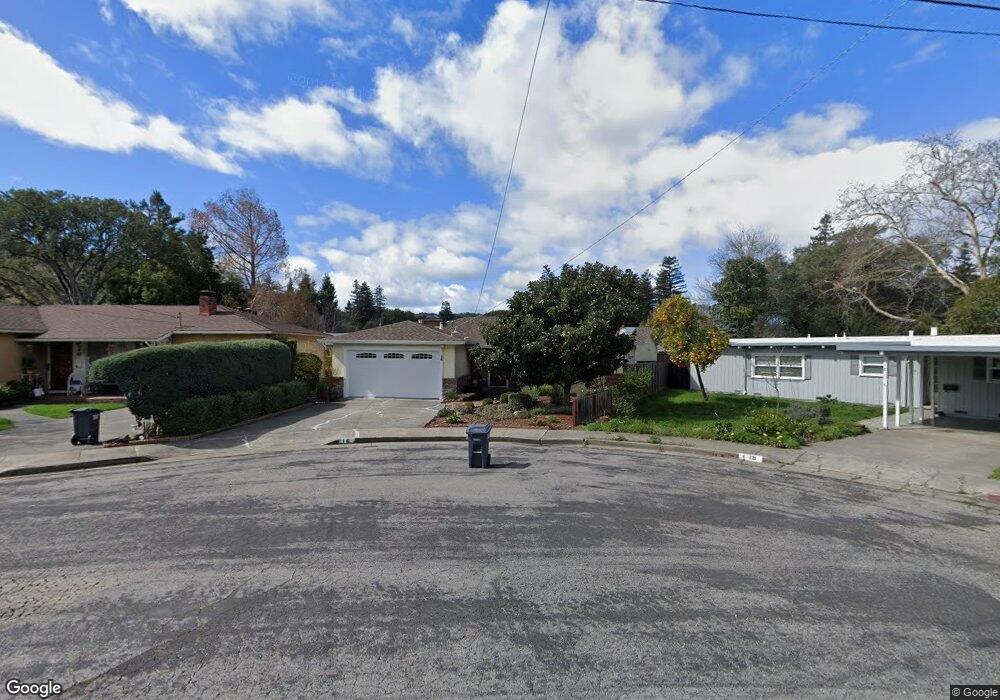
16 Brookside Way Petaluma, CA 94952
Western Petaluma NeighborhoodEstimated Value: $739,903 - $1,049,000
3
Beds
1
Bath
1,278
Sq Ft
$695/Sq Ft
Est. Value
About This Home
This home is located at 16 Brookside Way, Petaluma, CA 94952 and is currently estimated at $887,726, approximately $694 per square foot. 16 Brookside Way is a home located in Sonoma County with nearby schools including McNear Elementary School, Petaluma Junior High School, and Petaluma High School.
Ownership History
Date
Name
Owned For
Owner Type
Purchase Details
Closed on
Sep 27, 2011
Sold by
Feerick Patricia J and Feerick Devi P
Bought by
Feerick Devi P and Feerick Jolie D
Current Estimated Value
Purchase Details
Closed on
Jun 24, 2010
Sold by
Feerick John B and Feerick Patricia Jane
Bought by
Feerick John B and The John B Feerick Revocable T
Home Financials for this Owner
Home Financials are based on the most recent Mortgage that was taken out on this home.
Original Mortgage
$248,850
Interest Rate
4.79%
Mortgage Type
New Conventional
Purchase Details
Closed on
Mar 22, 1999
Sold by
Feerick John B
Bought by
Feerick John B and The John B Feerick Revocable T
Purchase Details
Closed on
Jun 7, 1996
Sold by
Nelson Barbara A
Bought by
Nelson Newman B
Create a Home Valuation Report for This Property
The Home Valuation Report is an in-depth analysis detailing your home's value as well as a comparison with similar homes in the area
Home Values in the Area
Average Home Value in this Area
Purchase History
| Date | Buyer | Sale Price | Title Company |
|---|---|---|---|
| Feerick Devi P | -- | None Available | |
| Feerick John B | -- | Orange Coast Title | |
| Feerick John B | -- | Orange Coast Title | |
| Feerick John B | -- | -- | |
| Nelson Newman B | -- | -- |
Source: Public Records
Mortgage History
| Date | Status | Borrower | Loan Amount |
|---|---|---|---|
| Closed | Feerick John B | $248,850 |
Source: Public Records
Tax History
| Year | Tax Paid | Tax Assessment Tax Assessment Total Assessment is a certain percentage of the fair market value that is determined by local assessors to be the total taxable value of land and additions on the property. | Land | Improvement |
|---|---|---|---|---|
| 2025 | $1,622 | $131,815 | $23,545 | $108,270 |
| 2024 | $1,622 | $129,232 | $23,084 | $106,148 |
| 2023 | $1,622 | $126,699 | $22,632 | $104,067 |
| 2022 | $1,505 | $124,216 | $22,189 | $102,027 |
| 2021 | $1,479 | $121,781 | $21,754 | $100,027 |
| 2020 | $1,491 | $120,533 | $21,531 | $99,002 |
| 2019 | $1,474 | $118,170 | $21,109 | $97,061 |
| 2018 | $1,469 | $115,854 | $20,696 | $95,158 |
| 2017 | $1,440 | $113,584 | $20,291 | $93,293 |
| 2016 | $1,400 | $111,358 | $19,894 | $91,464 |
| 2015 | $1,382 | $109,687 | $19,596 | $90,091 |
| 2014 | $1,376 | $107,540 | $19,213 | $88,327 |
Source: Public Records
Map
Nearby Homes
- 1170 I St
- 21 Branching Way
- 1309 D Street Extension
- 618 E St
- 11 10th St
- 720 Petaluma Blvd S Unit 28
- 16 7th St
- 22 Oak Knoll Ct
- 1021 Mcnear Ave
- 105 G St
- 100 Orchard Ln
- 1280 Petaluma Blvd S
- 131 Liberty St
- 136 Court St
- 45 Augusta Cir
- 0 Lakeville St
- 534 Jade St
- 134 Grevillia Dr
- 1805 Alvarado St
- 417 Jacquelyn Ln
- 10 Brookside Way
- 18 Brookside Way
- 22 Brookside Way
- 621 Sunnyslope Ave
- 6 Brookside Way
- 19 Brookside Way
- 625 Sunnyslope Ave
- 15 Brookside Way
- 11 Brookside Way
- 635 Sunnyslope Ave
- 910 I St
- 904 I St
- 920 I St
- 902 I St
- 930 I St
- 614 Sunnyslope Ave
- 620 Sunnyslope Ave
- 626 Sunnyslope Ave
- 630 Sunnyslope Ave
- 610 Sunnyslope Ave
Your Personal Tour Guide
Ask me questions while you tour the home.