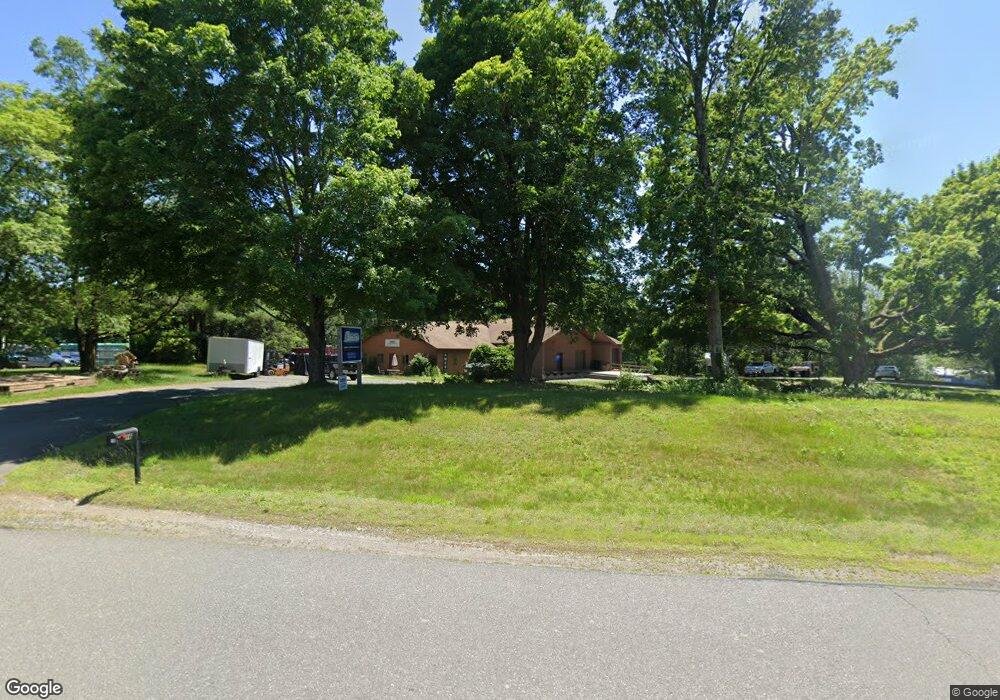
16 Butternut St Greenfield, MA 01301
Estimated Value: $570,755
--
Bed
1
Bath
600
Sq Ft
$951/Sq Ft
Est. Value
About This Home
This home is located at 16 Butternut St, Greenfield, MA 01301 and is currently estimated at $570,755, approximately $951 per square foot. 16 Butternut St is a home located in Franklin County.
Ownership History
Date
Name
Owned For
Owner Type
Purchase Details
Closed on
Sep 20, 2022
Sold by
Noyes William B and Cleary Dennis J
Bought by
Radial Realty Llc
Current Estimated Value
Home Financials for this Owner
Home Financials are based on the most recent Mortgage that was taken out on this home.
Original Mortgage
$235,000
Outstanding Balance
$224,039
Interest Rate
4.99%
Mortgage Type
Purchase Money Mortgage
Estimated Equity
$346,716
Purchase Details
Closed on
Dec 28, 1994
Sold by
Greenfield Sb
Bought by
Noyes William B and Cleary Dennis J
Home Financials for this Owner
Home Financials are based on the most recent Mortgage that was taken out on this home.
Original Mortgage
$65,000
Interest Rate
9.2%
Mortgage Type
Commercial
Purchase Details
Closed on
Aug 19, 1992
Sold by
Milton-Borofsky
Bought by
Greenfield Co-Op Bk
Create a Home Valuation Report for This Property
The Home Valuation Report is an in-depth analysis detailing your home's value as well as a comparison with similar homes in the area
Home Values in the Area
Average Home Value in this Area
Purchase History
| Date | Buyer | Sale Price | Title Company |
|---|---|---|---|
| Radial Realty Llc | $470,000 | None Available | |
| Radial Realty Llc | $470,000 | None Available | |
| Radial Realty Llc | $470,000 | None Available | |
| Noyes William B | $165,000 | -- | |
| Noyes William B | $165,000 | -- | |
| Greenfield Co-Op Bk | $200,000 | -- | |
| Greenfield Co-Op Bk | $200,000 | -- |
Source: Public Records
Mortgage History
| Date | Status | Borrower | Loan Amount |
|---|---|---|---|
| Open | Radial Realty Llc | $235,000 | |
| Closed | Radial Realty Llc | $235,000 | |
| Previous Owner | Greenfield Co-Op Bk | $65,000 | |
| Closed | Greenfield Co-Op Bk | $60,000 |
Source: Public Records
Tax History Compared to Growth
Tax History
| Year | Tax Paid | Tax Assessment Tax Assessment Total Assessment is a certain percentage of the fair market value that is determined by local assessors to be the total taxable value of land and additions on the property. | Land | Improvement |
|---|---|---|---|---|
| 2025 | $7,787 | $398,100 | $128,300 | $269,800 |
| 2024 | $8,798 | $431,500 | $128,300 | $303,200 |
| 2023 | $8,797 | $447,700 | $118,700 | $329,000 |
| 2022 | $10,274 | $460,300 | $114,300 | $346,000 |
| 2021 | $10,319 | $444,400 | $109,900 | $334,500 |
| 2020 | $9,475 | $413,200 | $109,900 | $303,300 |
| 2019 | $9,300 | $415,900 | $109,900 | $306,000 |
| 2018 | $8,889 | $396,300 | $105,100 | $291,200 |
| 2017 | $8,612 | $396,300 | $105,100 | $291,200 |
| 2016 | $8,741 | $400,800 | $105,100 | $295,700 |
| 2015 | $8,090 | $359,400 | $102,700 | $256,700 |
| 2014 | $7,475 | $364,100 | $102,700 | $261,400 |
Source: Public Records
Map
Nearby Homes
- 001 Adams Rd
- 793 Bernardston Rd
- 31 Lovers Ln
- 971 Bernardston Rd
- 72 Meadowood Dr
- 2 G St
- 79 Burnham Rd
- 187 L St
- 16 Coolidge Ave
- 29 Unity St
- 18 Crocker Ave
- 44 Wildwood Ave
- 0 Millers Falls Rd Unit 73034825
- Lot 16 Country Club Rd
- 87 Oakland St
- 137 French King Hwy
- 14 Warner St
- 335 Federal St
- 88 Turners Falls Rd
- 35-37 Shattuck St
- 33 Butternut St
- 128 Adams Rd
- 15 Greenfield St
- 24 Silvio O Conte Dr
- 64 Adams Rd
- 29 Silvio O Conte Dr
- 58 Adams Rd
- 0 Greenfield St
- 19 Silvio O Conte Dr
- 37 Silvio O Conte Dr
- 23 Woodland Dr
- 42 Adams Rd
- 49 Adams Rd
- 48 Adams Rd
- 29A Conte Dr
- 44 Adams Rd
- 45 Adams Rd
- 42 Adams Rd Unit 56
- 42 Adams Rd Unit 47
- 42 Adams Rd Unit 20