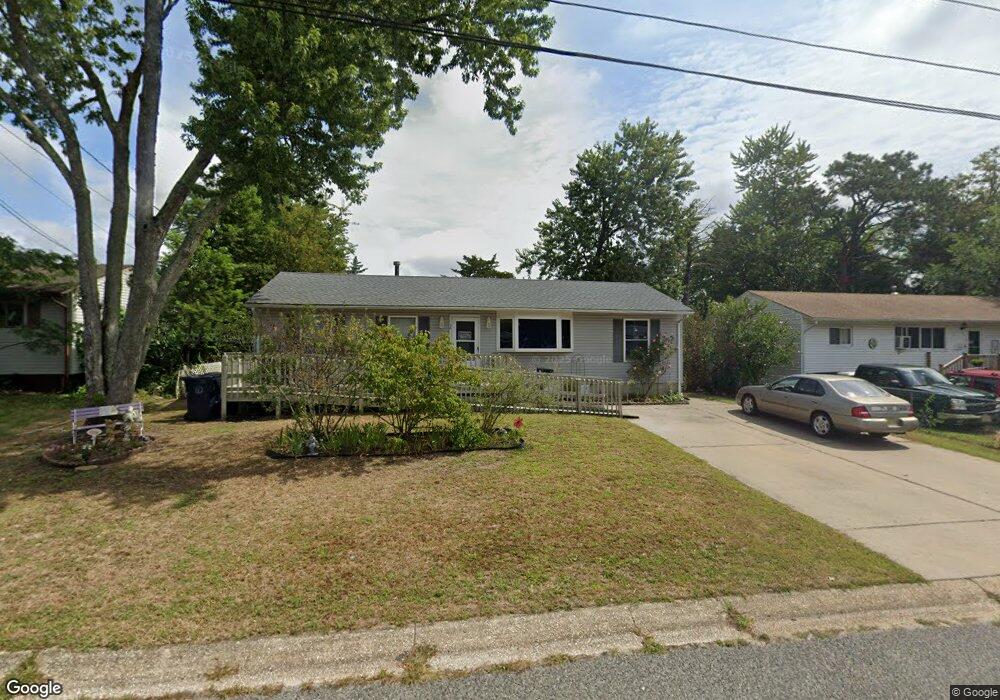
16 Carnegie St Toms River, NJ 08757
Estimated Value: $379,000 - $431,000
4
Beds
2
Baths
1,360
Sq Ft
$304/Sq Ft
Est. Value
About This Home
This home is located at 16 Carnegie St, Toms River, NJ 08757 and is currently estimated at $412,809, approximately $303 per square foot. 16 Carnegie St is a home located in Ocean County with nearby schools including St Joseph Grade School, Ambassador Christian Academy, and Ocean Academy.
Ownership History
Date
Name
Owned For
Owner Type
Purchase Details
Closed on
Jul 25, 2008
Sold by
Newbury Sherrie and Alaimo Phyllis
Bought by
Meyer Franklin G
Current Estimated Value
Home Financials for this Owner
Home Financials are based on the most recent Mortgage that was taken out on this home.
Original Mortgage
$204,300
Outstanding Balance
$134,447
Interest Rate
6.47%
Mortgage Type
VA
Estimated Equity
$278,362
Purchase Details
Closed on
Dec 23, 2004
Sold by
Alaimo Phyllis
Bought by
Alaimo Phyllis
Home Financials for this Owner
Home Financials are based on the most recent Mortgage that was taken out on this home.
Original Mortgage
$107,000
Interest Rate
8.2%
Mortgage Type
Fannie Mae Freddie Mac
Purchase Details
Closed on
Oct 21, 1996
Sold by
Barbato Maryann
Bought by
Alaimo Charles and Alaimo Phyllis
Create a Home Valuation Report for This Property
The Home Valuation Report is an in-depth analysis detailing your home's value as well as a comparison with similar homes in the area
Home Values in the Area
Average Home Value in this Area
Purchase History
| Date | Buyer | Sale Price | Title Company |
|---|---|---|---|
| Meyer Franklin G | $200,000 | None Available | |
| Alaimo Phyllis | -- | New Vision Title Agency Llc | |
| Alaimo Charles | $61,000 | -- |
Source: Public Records
Mortgage History
| Date | Status | Borrower | Loan Amount |
|---|---|---|---|
| Open | Meyer Franklin G | $204,300 | |
| Previous Owner | Alaimo Phyllis | $107,000 |
Source: Public Records
Tax History Compared to Growth
Tax History
| Year | Tax Paid | Tax Assessment Tax Assessment Total Assessment is a certain percentage of the fair market value that is determined by local assessors to be the total taxable value of land and additions on the property. | Land | Improvement |
|---|---|---|---|---|
| 2025 | $5,981 | $182,000 | $66,000 | $116,000 |
| 2024 | $5,519 | $182,000 | $66,000 | $116,000 |
| 2023 | $5,372 | $182,000 | $66,000 | $116,000 |
| 2022 | $5,622 | $182,000 | $66,000 | $116,000 |
| 2021 | $5,325 | $182,000 | $66,000 | $116,000 |
| 2020 | $5,433 | $182,000 | $66,000 | $116,000 |
| 2019 | $5,380 | $182,000 | $66,000 | $116,000 |
| 2018 | $5,283 | $182,000 | $66,000 | $116,000 |
| 2017 | $5,211 | $182,000 | $66,000 | $116,000 |
| 2016 | $4,835 | $182,000 | $66,000 | $116,000 |
| 2015 | $5,449 | $249,600 | $100,000 | $149,600 |
| 2014 | $5,244 | $249,600 | $100,000 | $149,600 |
Source: Public Records
Map
Nearby Homes