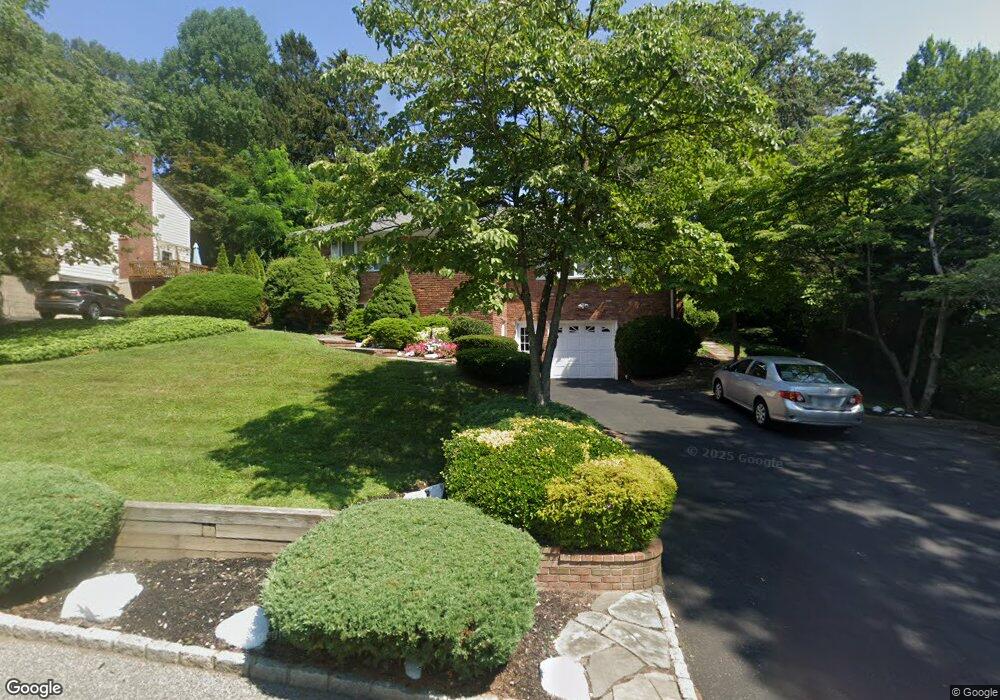
16 Cedar Ln Glen Head, NY 11545
Estimated Value: $914,164 - $994,000
Studio
2
Baths
1,293
Sq Ft
$738/Sq Ft
Est. Value
About This Home
This home is located at 16 Cedar Ln, Glen Head, NY 11545 and is currently estimated at $954,082, approximately $737 per square foot. 16 Cedar Ln is a home located in Nassau County with nearby schools including North Shore Middle School, North Shore Senior High School, and Green Vale School.
Ownership History
Date
Name
Owned For
Owner Type
Purchase Details
Closed on
Jul 12, 2018
Sold by
Esposito Marie
Bought by
Esposito Trust
Current Estimated Value
Purchase Details
Closed on
Jun 18, 2018
Sold by
Esposito Marie and Esposito Basilio
Bought by
Esposito Marie
Purchase Details
Closed on
Jan 11, 2002
Sold by
Augenthaler Charles
Bought by
Creditor Jay L
Purchase Details
Closed on
Jan 7, 1999
Sold by
Port Realty Group Llc
Bought by
Esposito Marie and Esposito Basilio
Purchase Details
Closed on
Sep 1, 1998
Sold by
Mortgage Federal Home Loan Cor
Bought by
Port Realty Group Llc
Purchase Details
Closed on
May 6, 1998
Sold by
Referee-Bergman Esq Bruce
Bought by
Federal Home Loan Mtg Cor
Create a Home Valuation Report for This Property
The Home Valuation Report is an in-depth analysis detailing your home's value as well as a comparison with similar homes in the area
Home Values in the Area
Average Home Value in this Area
Purchase History
| Date | Buyer | Sale Price | Title Company |
|---|---|---|---|
| Esposito Trust | -- | None Available | |
| Esposito Trust | -- | None Available | |
| Esposito Trust | -- | None Available | |
| Esposito Marie | -- | None Available | |
| Esposito Marie | -- | None Available | |
| Esposito Marie | -- | None Available | |
| Creditor Jay L | $372,300 | Paul Creditor | |
| Creditor Jay L | $372,300 | Paul Creditor | |
| Esposito Marie | $270,000 | -- | |
| Esposito Marie | $270,000 | -- | |
| Port Realty Group Llc | $215,500 | -- | |
| Port Realty Group Llc | $215,500 | -- | |
| Federal Home Loan Mtg Cor | $200,000 | -- | |
| Federal Home Loan Mtg Cor | $200,000 | -- |
Source: Public Records
Tax History
| Year | Tax Paid | Tax Assessment Tax Assessment Total Assessment is a certain percentage of the fair market value that is determined by local assessors to be the total taxable value of land and additions on the property. | Land | Improvement |
|---|---|---|---|---|
| 2025 | $13,615 | $575 | $258 | $317 |
| 2024 | $3,877 | $558 | $250 | $308 |
Source: Public Records
Map
Nearby Homes
- 9 Hill Dr
- 2 Elm St
- 9 Hillside Ave
- 1 Private Ln
- 16 Underhill Rd
- 8 Dumond Place
- 13 Walnut St
- 2 Terry Ct
- 20 Michaels Ln
- 92 Valentine Ave
- 22 Knott Dr
- 33 High Farms Rd
- 10 High Farms Rd
- 40 Valentine Ave
- 14 Harbor Ln
- 226 Glen Cove Ave
- 70A Sea Cliff Ave Unit 70A
- 1 Pine Hill Terrace
- 10 Glen Keith Rd Unit U
- 2 T Coolidge Ave
Your Personal Tour Guide
Ask me questions while you tour the home.