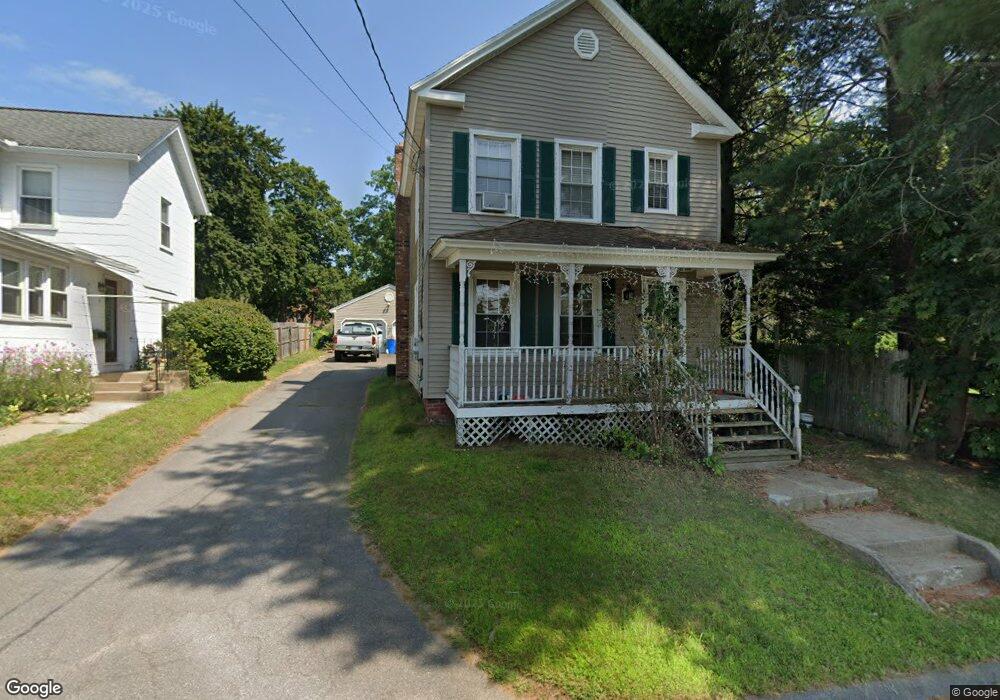
16 Cedar St Enfield, CT 06082
Estimated Value: $276,665 - $311,000
3
Beds
6
Baths
1,240
Sq Ft
$233/Sq Ft
Est. Value
About This Home
This home is located at 16 Cedar St, Enfield, CT 06082 and is currently estimated at $288,666, approximately $232 per square foot. 16 Cedar St is a home located in Hartford County with nearby schools including Hazardville Memorial Elementary School, Eli Whitney Elementary School, and Enfield High School.
Ownership History
Date
Name
Owned For
Owner Type
Purchase Details
Closed on
Jan 11, 2010
Sold by
Quail Brenda and Quail Nicole
Bought by
Gagnon Jeremy and Gagnon Meghan
Current Estimated Value
Home Financials for this Owner
Home Financials are based on the most recent Mortgage that was taken out on this home.
Original Mortgage
$171,700
Outstanding Balance
$111,581
Interest Rate
4.75%
Mortgage Type
FHA
Estimated Equity
$177,085
Purchase Details
Closed on
Jul 30, 2007
Sold by
Lundie Bruce and Lundie Patricia
Bought by
Quail Brenda and Quail Nicole
Home Financials for this Owner
Home Financials are based on the most recent Mortgage that was taken out on this home.
Original Mortgage
$201,350
Interest Rate
6.78%
Purchase Details
Closed on
May 24, 1993
Sold by
Anderson Darbi Anne
Bought by
Lundie Bruce and Lundie Patricia
Create a Home Valuation Report for This Property
The Home Valuation Report is an in-depth analysis detailing your home's value as well as a comparison with similar homes in the area
Home Values in the Area
Average Home Value in this Area
Purchase History
| Date | Buyer | Sale Price | Title Company |
|---|---|---|---|
| Gagnon Jeremy | $174,900 | -- | |
| Quail Brenda | $203,000 | -- | |
| Lundie Bruce | $85,000 | -- |
Source: Public Records
Mortgage History
| Date | Status | Borrower | Loan Amount |
|---|---|---|---|
| Open | Lundie Bruce | $171,700 | |
| Closed | Lundie Bruce | $13,900 | |
| Previous Owner | Lundie Bruce | $201,350 |
Source: Public Records
Tax History
| Year | Tax Paid | Tax Assessment Tax Assessment Total Assessment is a certain percentage of the fair market value that is determined by local assessors to be the total taxable value of land and additions on the property. | Land | Improvement |
|---|---|---|---|---|
| 2025 | $4,633 | $132,000 | $45,400 | $86,600 |
| 2024 | $4,463 | $132,000 | $45,400 | $86,600 |
| 2023 | $4,430 | $132,000 | $45,400 | $86,600 |
| 2022 | $4,077 | $132,000 | $45,400 | $86,600 |
| 2021 | $4,203 | $111,860 | $37,560 | $74,300 |
| 2020 | $4,175 | $111,860 | $37,560 | $74,300 |
| 2019 | $4,169 | $111,860 | $37,560 | $74,300 |
| 2018 | $4,057 | $111,860 | $37,560 | $74,300 |
| 2017 | $3,812 | $111,860 | $37,560 | $74,300 |
| 2016 | $3,683 | $110,390 | $37,560 | $72,830 |
| 2015 | $3,570 | $110,390 | $37,560 | $72,830 |
| 2014 | $3,481 | $110,390 | $37,560 | $72,830 |
Source: Public Records
Map
Nearby Homes
Your Personal Tour Guide
Ask me questions while you tour the home.