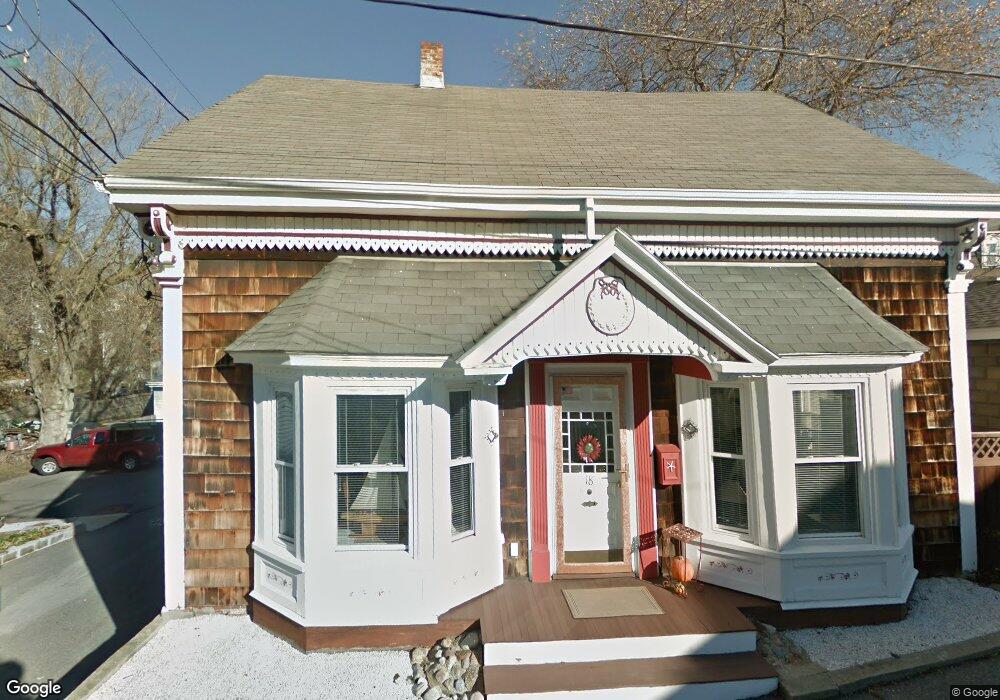
16 Central Ct Beverly, MA 01915
Downtown Beverly NeighborhoodEstimated Value: $658,574 - $851,000
5
Beds
2
Baths
1,760
Sq Ft
$428/Sq Ft
Est. Value
About This Home
This home is located at 16 Central Ct, Beverly, MA 01915 and is currently estimated at $753,144, approximately $427 per square foot. 16 Central Ct is a home located in Essex County with nearby schools including Beverly High School, Mrs Alexander's School, and Shore Country Day School.
Ownership History
Date
Name
Owned For
Owner Type
Purchase Details
Closed on
Mar 13, 1998
Sold by
Alden Daniel S and Alden Kathleen
Bought by
Alden Sheila C and Alden Daniel S
Current Estimated Value
Home Financials for this Owner
Home Financials are based on the most recent Mortgage that was taken out on this home.
Original Mortgage
$70,000
Interest Rate
7.03%
Mortgage Type
Purchase Money Mortgage
Create a Home Valuation Report for This Property
The Home Valuation Report is an in-depth analysis detailing your home's value as well as a comparison with similar homes in the area
Home Values in the Area
Average Home Value in this Area
Purchase History
| Date | Buyer | Sale Price | Title Company |
|---|---|---|---|
| Alden Sheila C | $60,000 | -- |
Source: Public Records
Mortgage History
| Date | Status | Borrower | Loan Amount |
|---|---|---|---|
| Open | Alden Sheila C | $50,000 | |
| Open | Alden Sheila C | $80,000 | |
| Closed | Alden Sheila C | $70,000 |
Source: Public Records
Tax History
| Year | Tax Paid | Tax Assessment Tax Assessment Total Assessment is a certain percentage of the fair market value that is determined by local assessors to be the total taxable value of land and additions on the property. | Land | Improvement |
|---|---|---|---|---|
| 2025 | $5,607 | $510,200 | $300,200 | $210,000 |
| 2024 | $5,730 | $510,200 | $300,200 | $210,000 |
| 2023 | $5,614 | $498,600 | $288,600 | $210,000 |
| 2022 | $5,191 | $426,500 | $216,500 | $210,000 |
| 2021 | $5,011 | $394,600 | $206,400 | $188,200 |
| 2020 | $4,521 | $352,400 | $164,200 | $188,200 |
| 2019 | $4,193 | $317,400 | $135,300 | $182,100 |
| 2018 | $3,722 | $273,700 | $108,200 | $165,500 |
| 2017 | $3,267 | $228,800 | $63,300 | $165,500 |
| 2016 | $3,292 | $228,800 | $63,300 | $165,500 |
| 2015 | $3,228 | $228,800 | $63,300 | $165,500 |
Source: Public Records
Map
Nearby Homes
- 23 1/2 Lovett St
- 24 Franklin Place
- 13 Fayette St Unit 3
- 40 Railroad Ave Unit B2
- 60 Rantoul St Unit 604N
- 60 Rantoul St Unit 114N
- 50 Rantoul St Unit 509S
- 16 School St Unit 3
- 12 Summit Ave Unit 4
- 17 Pond St
- 261 Rantoul St
- 28 Arthur St Unit 3
- The Cabot Collection
- 315 Rantoul St Unit 406
- 34 Chase St
- 348 Rantoul St Unit 202
- 6 Pilgrim Heights
- 42 Bisson St
- 3 Elm Top Ln
- 94 Essex St
Your Personal Tour Guide
Ask me questions while you tour the home.