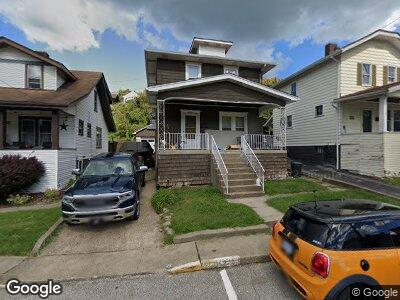
16 Chestnut St Bridgeport, OH 43912
Estimated Value: $90,000 - $164,000
2
Beds
2
Baths
1,904
Sq Ft
$62/Sq Ft
Est. Value
About This Home
This home is located at 16 Chestnut St, Bridgeport, OH 43912 and is currently estimated at $118,555, approximately $62 per square foot. 16 Chestnut St is a home located in Belmont County with nearby schools including Bridgeport Elementary School, Bridgeport Middle School, and Bridgeport High School.
Ownership History
Date
Name
Owned For
Owner Type
Purchase Details
Closed on
Sep 14, 2006
Sold by
Clark Charles F and Estate Of Irma Irene Clark
Bought by
Moore Jerry E
Current Estimated Value
Home Financials for this Owner
Home Financials are based on the most recent Mortgage that was taken out on this home.
Original Mortgage
$56,700
Interest Rate
6.58%
Mortgage Type
Purchase Money Mortgage
Purchase Details
Closed on
Jan 1, 1986
Sold by
Clark Irma Irene
Bought by
Clark Irma Irene
Create a Home Valuation Report for This Property
The Home Valuation Report is an in-depth analysis detailing your home's value as well as a comparison with similar homes in the area
Home Values in the Area
Average Home Value in this Area
Purchase History
| Date | Buyer | Sale Price | Title Company |
|---|---|---|---|
| Moore Jerry E | $63,000 | None Available | |
| Clark Irma Irene | -- | -- |
Source: Public Records
Mortgage History
| Date | Status | Borrower | Loan Amount |
|---|---|---|---|
| Open | Moore Jerry E | $62,100 | |
| Closed | Moore Ii Jerry E | $49,200 | |
| Closed | Moore Ii Jerry E | $11,405 | |
| Closed | Moore Jerry E | $23,974 | |
| Closed | Moore Jerry E | $56,700 | |
| Closed | Moore Ii Jerry E | $6,300 |
Source: Public Records
Tax History Compared to Growth
Tax History
| Year | Tax Paid | Tax Assessment Tax Assessment Total Assessment is a certain percentage of the fair market value that is determined by local assessors to be the total taxable value of land and additions on the property. | Land | Improvement |
|---|---|---|---|---|
| 2024 | $1,350 | $27,120 | $2,750 | $24,370 |
| 2023 | $1,417 | $25,840 | $2,750 | $23,090 |
| 2022 | $1,057 | $25,844 | $2,754 | $23,090 |
| 2021 | $1,072 | $25,840 | $2,754 | $23,086 |
| 2020 | $929 | $22,470 | $2,390 | $20,080 |
| 2019 | $931 | $22,470 | $2,390 | $20,080 |
| 2018 | $952 | $22,470 | $2,390 | $20,080 |
| 2017 | $1,059 | $23,190 | $2,850 | $20,340 |
| 2016 | $1,040 | $23,190 | $2,850 | $20,340 |
| 2015 | $1,036 | $23,190 | $2,850 | $20,340 |
| 2014 | $1,079 | $23,560 | $2,590 | $20,970 |
| 2013 | $1,028 | $23,560 | $2,590 | $20,970 |
Source: Public Records
Map
Nearby Homes
- 1116 Howard St
- 56559 Boyd Ave
- 810 Howard St
- 516 Bennett St
- 55960 National Rd
- 508 W Bennett
- 67578 Kirkwood Heights Rd
- 211 Scotts Ln
- 67730 Kirkwood Heights Rd
- 67656 Kirkwood Heights Rd
- 68290 Orchard Ave
- 400 Ontario St Unit 402
- 129-131 S Huron St
- 220 N Wabash St
- 110 6th St
- 217 N Huron St
- 301 N Huron St
- 106 5th St
- 44 Kentucky St
- 219 S York St