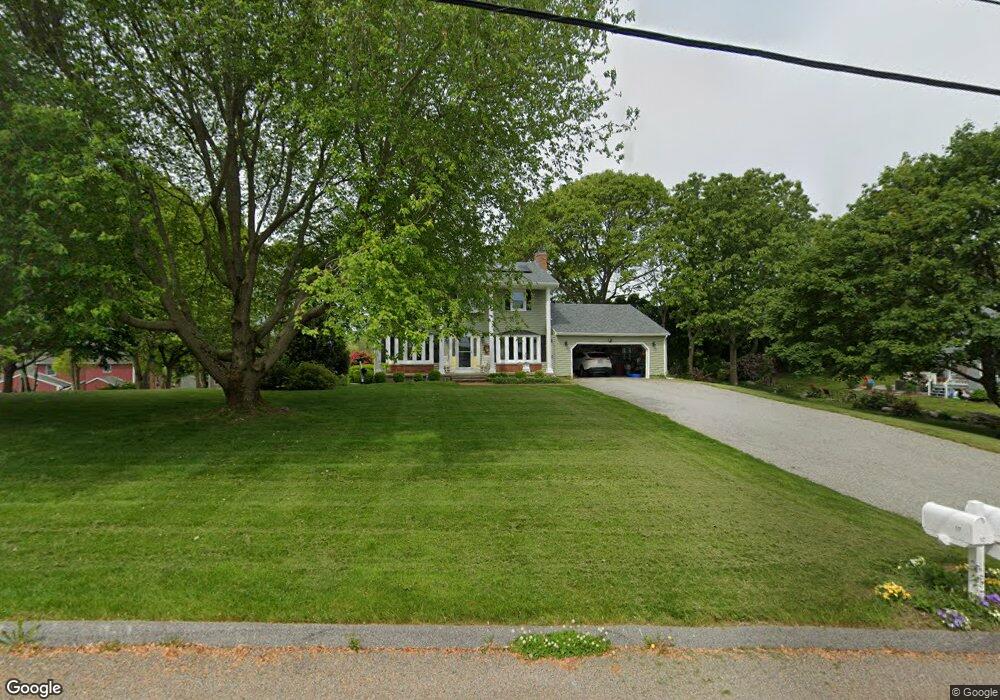
16 Chin Hill Rd Westerly, RI 02891
Estimated Value: $843,000 - $1,155,000
3
Beds
3
Baths
1,997
Sq Ft
$479/Sq Ft
Est. Value
About This Home
This home is located at 16 Chin Hill Rd, Westerly, RI 02891 and is currently estimated at $955,940, approximately $478 per square foot. 16 Chin Hill Rd is a home located in Washington County with nearby schools including Westerly High School and St. Michael School.
Ownership History
Date
Name
Owned For
Owner Type
Purchase Details
Closed on
May 12, 2023
Sold by
S R & Eleanor M Cote Irt and Page
Bought by
Cote Stephen R and Cote Eleanor M
Current Estimated Value
Purchase Details
Closed on
Mar 28, 2019
Sold by
Cote Stephen R and Cote Eleanor M
Bought by
Stephen R & E M Cote Irt and Page
Purchase Details
Closed on
Oct 30, 2003
Sold by
Profeta Robert and Profeta Martina
Bought by
Cote Stephen and Cote Eleanor
Purchase Details
Closed on
May 24, 2002
Sold by
Jones David L and Jones Sandra L
Bought by
Profeta Robert W and Profeta Martina
Purchase Details
Closed on
Sep 13, 1999
Sold by
Delicato Richard G
Bought by
Jones David L and Jones Sandra L
Create a Home Valuation Report for This Property
The Home Valuation Report is an in-depth analysis detailing your home's value as well as a comparison with similar homes in the area
Home Values in the Area
Average Home Value in this Area
Purchase History
| Date | Buyer | Sale Price | Title Company |
|---|---|---|---|
| Cote Stephen R | -- | None Available | |
| Stephen R & E M Cote Irt | -- | -- | |
| Cote Stephen | $370,000 | -- | |
| Profeta Robert W | $284,000 | -- | |
| Jones David L | $212,000 | -- |
Source: Public Records
Mortgage History
| Date | Status | Borrower | Loan Amount |
|---|---|---|---|
| Previous Owner | Jones David L | $47,800 | |
| Previous Owner | Jones David L | $182,000 | |
| Previous Owner | Jones David L | $182,000 |
Source: Public Records
Tax History Compared to Growth
Tax History
| Year | Tax Paid | Tax Assessment Tax Assessment Total Assessment is a certain percentage of the fair market value that is determined by local assessors to be the total taxable value of land and additions on the property. | Land | Improvement |
|---|---|---|---|---|
| 2025 | $5,305 | $746,100 | $311,500 | $434,600 |
| 2024 | $5,707 | $581,800 | $223,500 | $358,300 |
| 2023 | $5,114 | $531,600 | $223,500 | $308,100 |
| 2022 | $5,082 | $531,600 | $223,500 | $308,100 |
| 2021 | $5,117 | $444,200 | $194,700 | $249,500 |
| 2020 | $5,024 | $444,200 | $194,700 | $249,500 |
| 2019 | $4,975 | $444,200 | $194,700 | $249,500 |
| 2018 | $4,735 | $398,600 | $194,700 | $203,900 |
| 2017 | $4,620 | $398,600 | $194,700 | $203,900 |
| 2016 | $4,656 | $398,600 | $194,700 | $203,900 |
| 2015 | $4,488 | $414,800 | $198,500 | $216,300 |
| 2014 | $4,054 | $414,800 | $198,500 | $216,300 |
Source: Public Records
Map
Nearby Homes
- 7 Spring Pond Rd
- 18 No Bottom Ridge Ridge
- 13 No Bottom Ridge Rd
- 9 Cedar Crest Dr
- 18 Timothy Dr
- 10 Tristam St
- 2 Brass Ring Rd
- 26 Windward Dr
- 4 Shore Rd
- 417 River Rd
- 6 Newbury Dr
- 9 Compass Way Unit 201
- 9 Compass Way Unit 202
- 9 Compass Way Unit 101
- 9 Compass Way Unit 102
- 9 Compass Way Unit 103
- 9 Compass Way Unit 203
- 43 Avondale Rd
- 4 Quail Run
- 6 Fox Run Run
- 0 Chin Hill Rd
- 24 Chin Hill Rd
- 10 Happy Valley Rd
- 8 Happy Valley Rd
- 18 Chin Hill Rd
- 12 Happy Valley Rd
- 14 Chin Hill Rd
- 17 Chin Hill Rd
- 15 Chin Hill Rd
- 20 Chin Hill Rd
- 14 Happy Valley Rd
- 19 Chin Hill Rd
- 2 Happy Valley Rd
- 11 Happy Valley Rd
- 10 Chin Hill Rd
- 22 Chin Hill Rd
- 21 Chin Hill Rd
- 16 Happy Valley Rd
- 13 Happy Valley Rd
- 11 Chin Hill Rd