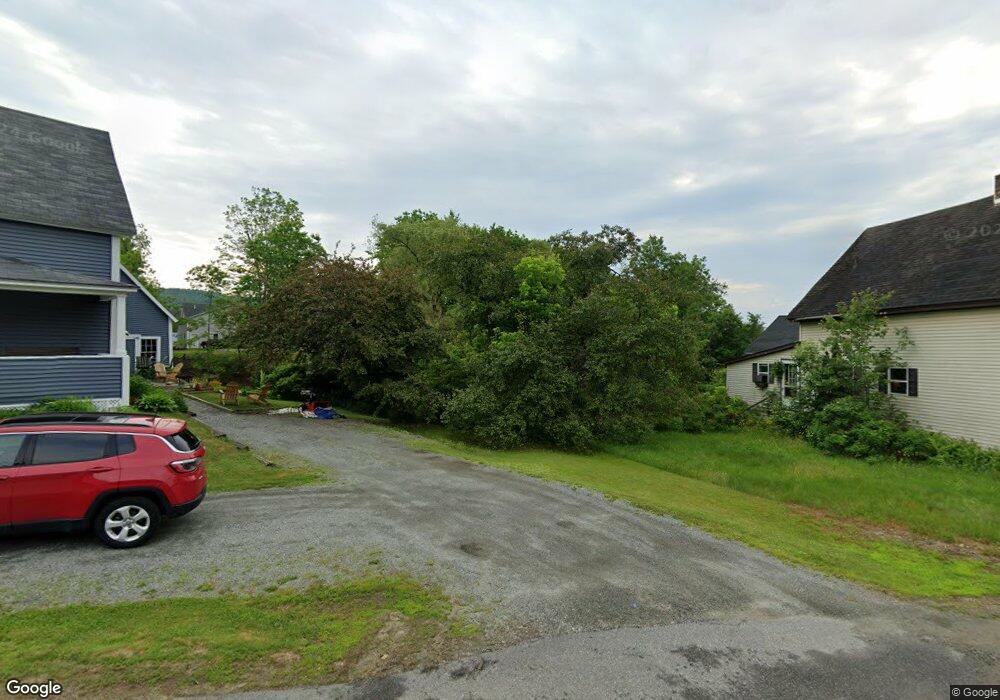
16 Chiswick Ave Littleton, NH 03561
Estimated Value: $128,000 - $187,000
4
Beds
1
Bath
871
Sq Ft
$186/Sq Ft
Est. Value
About This Home
This home is located at 16 Chiswick Ave, Littleton, NH 03561 and is currently estimated at $162,231, approximately $186 per square foot. 16 Chiswick Ave is a home located in Grafton County with nearby schools including Mildred C. Lakeway School, North Country Charter Academy (M), and North Country Charter Academy.
Ownership History
Date
Name
Owned For
Owner Type
Purchase Details
Closed on
Aug 27, 2021
Sold by
Papadimatos George
Bought by
Thoms Alexander M
Current Estimated Value
Home Financials for this Owner
Home Financials are based on the most recent Mortgage that was taken out on this home.
Original Mortgage
$89,351
Outstanding Balance
$81,303
Interest Rate
2.8%
Mortgage Type
FHA
Estimated Equity
$80,928
Purchase Details
Closed on
Feb 22, 2002
Sold by
Lucas Kimberly R
Bought by
Papadimatos George
Home Financials for this Owner
Home Financials are based on the most recent Mortgage that was taken out on this home.
Original Mortgage
$28,400
Interest Rate
7.08%
Purchase Details
Closed on
Mar 26, 1999
Sold by
Norris Glenn D and Norris Marlo J
Bought by
Lucas David
Home Financials for this Owner
Home Financials are based on the most recent Mortgage that was taken out on this home.
Original Mortgage
$32,250
Interest Rate
6.78%
Create a Home Valuation Report for This Property
The Home Valuation Report is an in-depth analysis detailing your home's value as well as a comparison with similar homes in the area
Home Values in the Area
Average Home Value in this Area
Purchase History
| Date | Buyer | Sale Price | Title Company |
|---|---|---|---|
| Thoms Alexander M | $91,000 | None Available | |
| Papadimatos George | $35,500 | -- | |
| Lucas David | $35,000 | -- |
Source: Public Records
Mortgage History
| Date | Status | Borrower | Loan Amount |
|---|---|---|---|
| Open | Thoms Alexander M | $89,351 | |
| Previous Owner | Lucas David | $28,400 | |
| Previous Owner | Lucas David | $32,250 |
Source: Public Records
Tax History Compared to Growth
Tax History
| Year | Tax Paid | Tax Assessment Tax Assessment Total Assessment is a certain percentage of the fair market value that is determined by local assessors to be the total taxable value of land and additions on the property. | Land | Improvement |
|---|---|---|---|---|
| 2024 | $2,130 | $85,400 | $14,400 | $71,000 |
| 2023 | $1,925 | $85,400 | $14,400 | $71,000 |
| 2022 | $1,969 | $85,400 | $14,400 | $71,000 |
| 2021 | $1,969 | $85,400 | $14,400 | $71,000 |
| 2020 | $1,849 | $85,400 | $14,400 | $71,000 |
| 2019 | $1,823 | $78,900 | $12,900 | $66,000 |
| 2018 | $1,823 | $78,900 | $12,900 | $66,000 |
| 2017 | $1,833 | $71,000 | $14,400 | $56,600 |
| 2016 | $1,853 | $71,500 | $14,900 | $56,600 |
| 2015 | $1,938 | $83,100 | $15,300 | $67,800 |
| 2014 | $1,845 | $83,100 | $15,300 | $67,800 |
| 2013 | $1,866 | $83,100 | $15,300 | $67,800 |
Source: Public Records
Map
Nearby Homes
- 93 Pleasant St
- 180 Beacon St
- 34 Union St
- 114 Highland Ave
- 33 Pleasant St
- 45 Point of View Dr
- 11 Richmond St
- 134 Cottage St
- 191 Washington St
- 36 MacIver Rd
- 194 Main St
- 14 Hilltop Manor Mobile Home Park
- 165 Bethlehem Rd
- 166 Riverside Dr
- 92-29 Birchcroft Dr
- 60-70 Meadow St
- 251 Bethlehem Rd
- 000 Dells Rd Unit 1
- 456 Brickyard Rd
- 00 Guider Ln