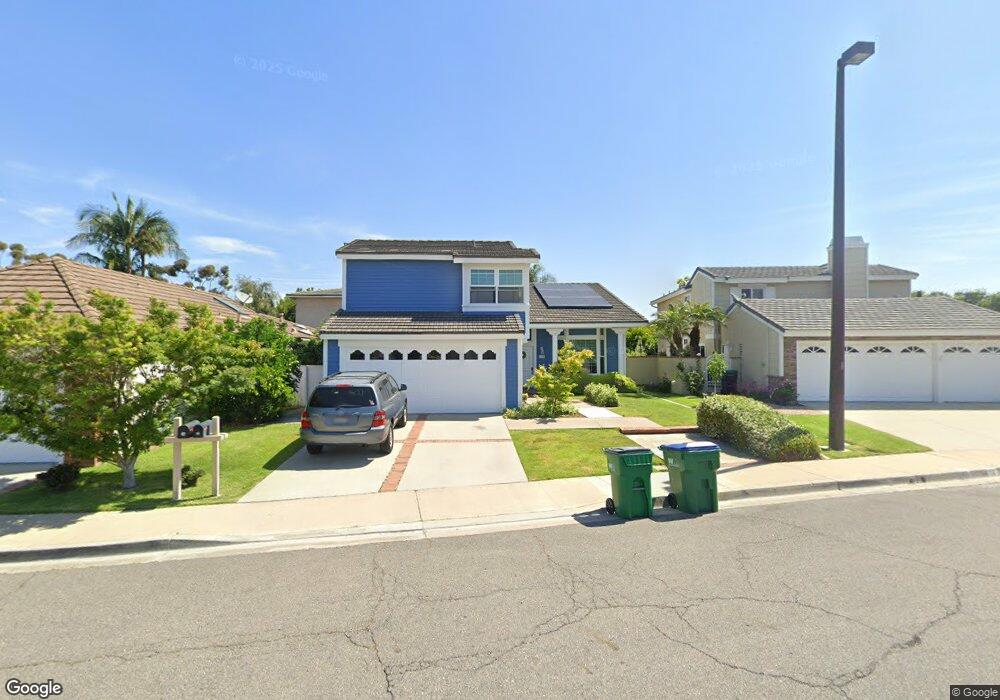
16 Coldbrook Irvine, CA 92604
Woodbridge NeighborhoodEstimated Value: $1,750,000 - $2,150,000
4
Beds
3
Baths
2,296
Sq Ft
$834/Sq Ft
Est. Value
About This Home
This home is located at 16 Coldbrook, Irvine, CA 92604 and is currently estimated at $1,915,759, approximately $834 per square foot. 16 Coldbrook is a home located in Orange County with nearby schools including Eastshore Elementary School, Lakeside Middle School, and Woodbridge High School.
Ownership History
Date
Name
Owned For
Owner Type
Purchase Details
Closed on
Jul 31, 2024
Sold by
Schwengel Raymond L and Schwengel Robyn A
Bought by
Raymond Lloyd Schwengel And Robyn Ann Schweng and Schwengel
Current Estimated Value
Purchase Details
Closed on
Jan 10, 2006
Sold by
Tseng Cheng Yen and Tseng Wu Shu Hei
Bought by
Schwengel Raymond L and Schwengel Robyn A
Home Financials for this Owner
Home Financials are based on the most recent Mortgage that was taken out on this home.
Original Mortgage
$490,000
Interest Rate
6.28%
Mortgage Type
Fannie Mae Freddie Mac
Purchase Details
Closed on
Dec 27, 2005
Sold by
Tseng Winnie
Bought by
Tseng Cheng Yen and Tseng Wu Shu Hei
Home Financials for this Owner
Home Financials are based on the most recent Mortgage that was taken out on this home.
Original Mortgage
$490,000
Interest Rate
6.28%
Mortgage Type
Fannie Mae Freddie Mac
Create a Home Valuation Report for This Property
The Home Valuation Report is an in-depth analysis detailing your home's value as well as a comparison with similar homes in the area
Home Values in the Area
Average Home Value in this Area
Purchase History
| Date | Buyer | Sale Price | Title Company |
|---|---|---|---|
| Raymond Lloyd Schwengel And Robyn Ann Schweng | -- | None Listed On Document | |
| Schwengel Raymond L | $898,000 | Fidelity National Title | |
| Tseng Cheng Yen | -- | Fidelity National Title | |
| Tseng Cheng Yen | -- | -- |
Source: Public Records
Mortgage History
| Date | Status | Borrower | Loan Amount |
|---|---|---|---|
| Previous Owner | Schwengel Raymond L | $490,000 |
Source: Public Records
Tax History
| Year | Tax Paid | Tax Assessment Tax Assessment Total Assessment is a certain percentage of the fair market value that is determined by local assessors to be the total taxable value of land and additions on the property. | Land | Improvement |
|---|---|---|---|---|
| 2025 | $12,926 | $1,234,182 | $955,633 | $278,549 |
| 2024 | $12,926 | $1,209,983 | $936,895 | $273,088 |
| 2023 | $12,593 | $1,186,258 | $918,524 | $267,734 |
| 2022 | $12,358 | $1,162,999 | $900,514 | $262,485 |
| 2021 | $12,078 | $1,140,196 | $882,857 | $257,339 |
| 2020 | $12,009 | $1,128,505 | $873,804 | $254,701 |
| 2019 | $11,743 | $1,106,378 | $856,671 | $249,707 |
| 2018 | $11,537 | $1,084,685 | $839,874 | $244,811 |
| 2017 | $11,299 | $1,063,417 | $823,406 | $240,011 |
| 2016 | $10,413 | $1,004,597 | $791,448 | $213,149 |
| 2015 | $10,256 | $989,508 | $779,560 | $209,948 |
| 2014 | $10,255 | $989,508 | $779,560 | $209,948 |
Source: Public Records
Map
Nearby Homes
- 35 Firwood
- 16 Driftwood Unit 24
- 7 E Yale Loop
- 36 Sunfish Unit 41
- 29 Sandstone
- 125 Briarglen
- 36 Bloomdale
- 3 Park Vista
- 81 Briarglen
- 8 Firebird Unit 78
- 95 Wildwood Unit 40
- 13 Shooting Star
- 18 Brookdale
- 9 Flaxwood
- 8 Sandpiper
- 65 Pinewood Unit 33
- 52 Shadowbrook
- 57 Pinewood Unit 29
- 527 Springbrook N
- 12 Oakdale
Your Personal Tour Guide
Ask me questions while you tour the home.