
Landlord's Agent in 2015
Steve Yang
eXp Realty
(617) 872-1878
17 Total Sales
Estimated Value: $1,325,000 - $1,664,000
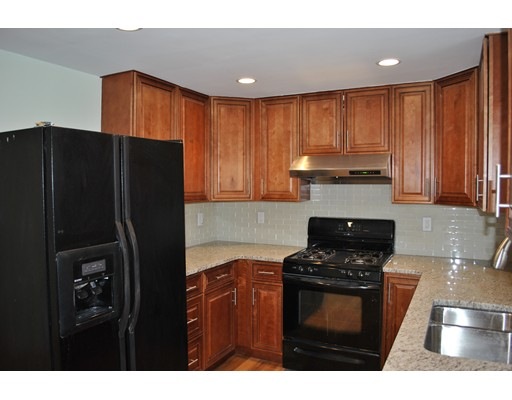
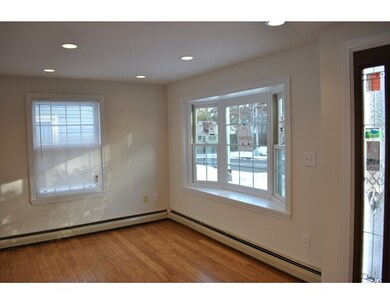
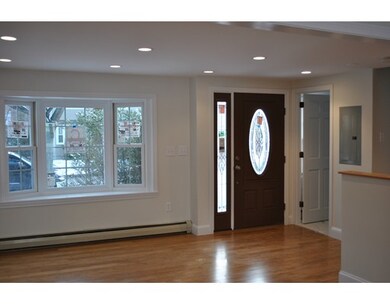
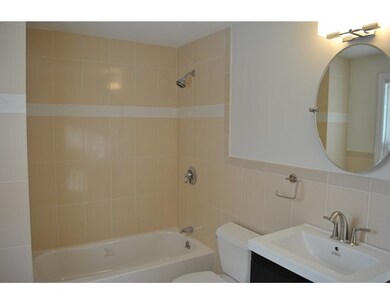
Attached single family home located between Kendal Square and East Cambridge. Short distance to both Kendal Square Red and Lechmere Green Line T station. A complete renovation with new kitchen w/ Granite Counter-top and all bathrooms are redone. All Hardwood floor, replacement windows and all new appliances. Fenced private yard with professional landscaping. One parking space. A quiet and tree lined street but close to school, shops, restaurants and playground. All utilities are extra. Available Mid Aug to Sept. 1 but could be few days earlier.
Last Renter's Agent
William DaSilva
Lamacchia Realty, Inc.
Home Type
Other
Est. Annual Taxes
$8,550
Year Built
1984
Lot Details
0
| Date | Buyer | Sale Price | Title Company |
|---|---|---|---|
| Tan Hong | -- | None Available | |
| Tan Hong | $710,000 | -- | |
| Tan Hong | $710,000 | -- | |
| Sharma Arun J | $206,000 | -- |
| Date | Status | Borrower | Loan Amount |
|---|---|---|---|
| Open | Tan Hong | $383,000 | |
| Previous Owner | Sharma Arun J | $20,000 | |
| Previous Owner | Sharma Arun J | $164,800 | |
| Closed | Sharma Arun J | $30,900 |
| Date | Event | Price | List to Sale | Price per Sq Ft |
|---|---|---|---|---|
| 07/13/2015 07/13/15 | Rented | $3,900 | 0.0% | -- |
| 07/13/2015 07/13/15 | For Rent | $3,900 | +13.0% | -- |
| 03/01/2015 03/01/15 | Rented | $3,450 | -5.5% | -- |
| 01/30/2015 01/30/15 | Under Contract | -- | -- | -- |
| 11/18/2014 11/18/14 | For Rent | $3,650 | -- | -- |
| Year | Tax Paid | Tax Assessment Tax Assessment Total Assessment is a certain percentage of the fair market value that is determined by local assessors to be the total taxable value of land and additions on the property. | Land | Improvement |
|---|---|---|---|---|
| 2025 | $8,550 | $1,346,400 | $556,300 | $790,100 |
| 2024 | $8,010 | $1,353,000 | $596,700 | $756,300 |
| 2023 | $7,165 | $1,222,700 | $556,000 | $666,700 |
| 2022 | $6,904 | $1,166,200 | $576,900 | $589,300 |
| 2021 | $12,176 | $1,095,900 | $553,900 | $542,000 |
| 2020 | $6,164 | $1,072,000 | $558,000 | $514,000 |
| 2019 | $6,068 | $1,021,500 | $547,300 | $474,200 |
| 2018 | $11,267 | $907,700 | $453,800 | $453,900 |
| 2017 | $5,396 | $831,500 | $405,800 | $425,700 |
| 2016 | $5,032 | $719,900 | $317,700 | $402,200 |
| 2015 | $3,992 | $510,500 | $272,300 | $238,200 |
| 2014 | $3,737 | $446,000 | $210,900 | $235,100 |
Landlord's Agent in 2015
Steve Yang
eXp Realty
(617) 872-1878
17 Total Sales
W
Tenant's Agent in 2015
William DaSilva
Lamacchia Realty, Inc.
Source: MLS Property Information Network (MLS PIN)
MLS Number: 71872343
APN: CAMB-000039-000000-000123
Disclaimer: Certain information contained herein is derived from information provided by parties other than Homes.com. All information provided is deemed reliable, but is not guaranteed to be accurate and should be independently verified.
![]() The property listing data and information, or the Images, set forth herein were provided to MLS Property Information Network, Inc. from third party sources, including sellers, lessors and public records, and were compiled by MLS Property Information Network, Inc. The property listing data and information, and the Images, are for the personal, non-commercial use of consumers having a good faith interest in purchasing or leasing listed properties of the type displayed to them and may not be used for any purpose other than to identify prospective properties which such consumers may have a good faith interest in purchasing or leasing. MLS Property Information Network, Inc. and its subscribers disclaim any and all representations and warranties as to the accuracy of the property listing data and information, or as to the accuracy of any of the Images, set forth herein.
The property listing data and information, or the Images, set forth herein were provided to MLS Property Information Network, Inc. from third party sources, including sellers, lessors and public records, and were compiled by MLS Property Information Network, Inc. The property listing data and information, and the Images, are for the personal, non-commercial use of consumers having a good faith interest in purchasing or leasing listed properties of the type displayed to them and may not be used for any purpose other than to identify prospective properties which such consumers may have a good faith interest in purchasing or leasing. MLS Property Information Network, Inc. and its subscribers disclaim any and all representations and warranties as to the accuracy of the property listing data and information, or as to the accuracy of any of the Images, set forth herein.