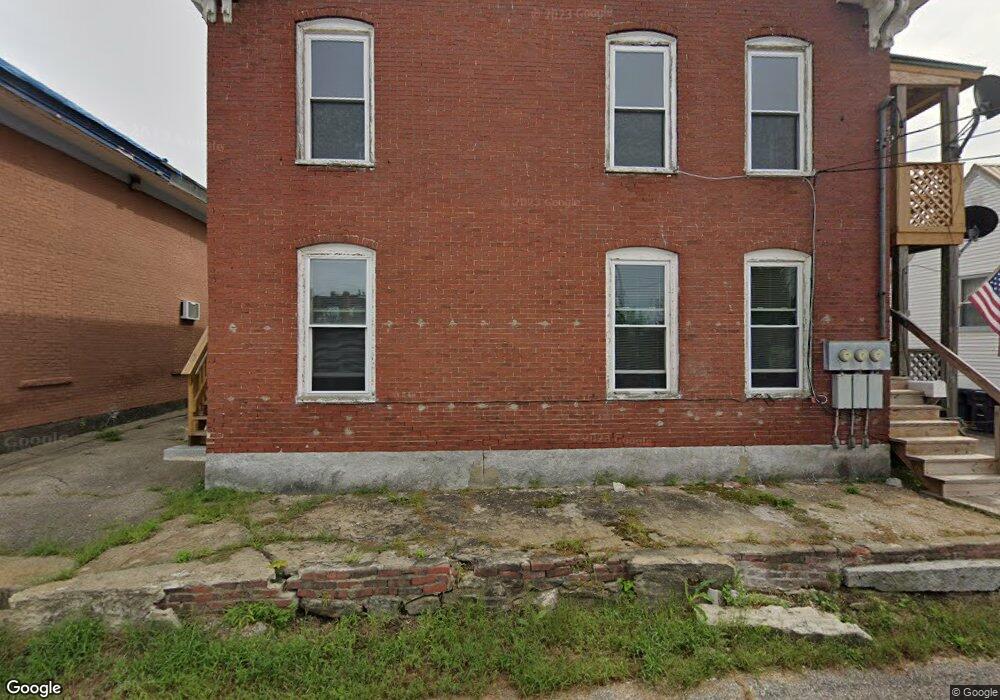
16 Crescent St Pembroke, NH 03275
Suncook NeighborhoodEstimated Value: $446,919 - $539,000
7
Beds
3
Baths
2,633
Sq Ft
$193/Sq Ft
Est. Value
About This Home
This home is located at 16 Crescent St, Pembroke, NH 03275 and is currently estimated at $507,230, approximately $192 per square foot. 16 Crescent St is a home located in Merrimack County with nearby schools including Pembroke Village School, Pembroke Hill School, and Three Rivers School.
Ownership History
Date
Name
Owned For
Owner Type
Purchase Details
Closed on
Dec 31, 2001
Sold by
Elliott Mambro Props L
Bought by
Michaud Scott J
Current Estimated Value
Home Financials for this Owner
Home Financials are based on the most recent Mortgage that was taken out on this home.
Original Mortgage
$147,276
Outstanding Balance
$58,340
Interest Rate
6.61%
Estimated Equity
$448,890
Purchase Details
Closed on
Mar 6, 2000
Sold by
Serif Rlty Llc
Bought by
Elliott Charlotte
Home Financials for this Owner
Home Financials are based on the most recent Mortgage that was taken out on this home.
Original Mortgage
$78,158
Interest Rate
8.21%
Purchase Details
Closed on
Dec 30, 1997
Sold by
Rpl Rt
Bought by
Serif Rlty Llc
Home Financials for this Owner
Home Financials are based on the most recent Mortgage that was taken out on this home.
Original Mortgage
$60,000
Interest Rate
7.15%
Create a Home Valuation Report for This Property
The Home Valuation Report is an in-depth analysis detailing your home's value as well as a comparison with similar homes in the area
Home Values in the Area
Average Home Value in this Area
Purchase History
| Date | Buyer | Sale Price | Title Company |
|---|---|---|---|
| Michaud Scott J | $148,500 | -- | |
| Elliott Charlotte | $97,000 | -- | |
| Serif Rlty Llc | $60,000 | -- |
Source: Public Records
Mortgage History
| Date | Status | Borrower | Loan Amount |
|---|---|---|---|
| Open | Serif Rlty Llc | $147,276 | |
| Previous Owner | Serif Rlty Llc | $78,158 | |
| Previous Owner | Serif Rlty Llc | $60,000 |
Source: Public Records
Tax History Compared to Growth
Tax History
| Year | Tax Paid | Tax Assessment Tax Assessment Total Assessment is a certain percentage of the fair market value that is determined by local assessors to be the total taxable value of land and additions on the property. | Land | Improvement |
|---|---|---|---|---|
| 2024 | $7,461 | $379,900 | $78,800 | $301,100 |
| 2023 | $6,608 | $237,000 | $52,500 | $184,500 |
| 2022 | $5,901 | $237,000 | $52,500 | $184,500 |
| 2021 | $5,688 | $237,000 | $52,500 | $184,500 |
| 2020 | $5,830 | $237,000 | $52,500 | $184,500 |
| 2019 | $5,588 | $237,000 | $52,500 | $184,500 |
| 2018 | $5,096 | $194,200 | $42,900 | $151,300 |
| 2017 | $5,779 | $194,200 | $42,900 | $151,300 |
| 2015 | $5,221 | $180,400 | $40,700 | $139,700 |
| 2014 | $5,358 | $180,400 | $40,700 | $139,700 |
| 2011 | $5,307 | $200,700 | $45,200 | $155,500 |
Source: Public Records
Map
Nearby Homes
- 12-14 Church St Unit 12,14
- 100 Main St Unit M10
- 100 Main St Unit 204
- 111 Glass St
- 7 Ferry St
- 4 Rodger Rd
- 1 1/2 Bartlett St
- 422 Dawn Dr Unit 23
- 427 Dawn Dr Unit 15
- 15 Main St
- 233 Pembroke St
- 19 Sullivan Dr
- 307 Dearborn Rd
- 259 Pembroke St
- 10 Lane Dr
- 2 Cheryl Dr
- 10 Winchester Ct
- 15 Sullivan Dr
- 347 Pembroke St
- 1821 Hooksett Rd