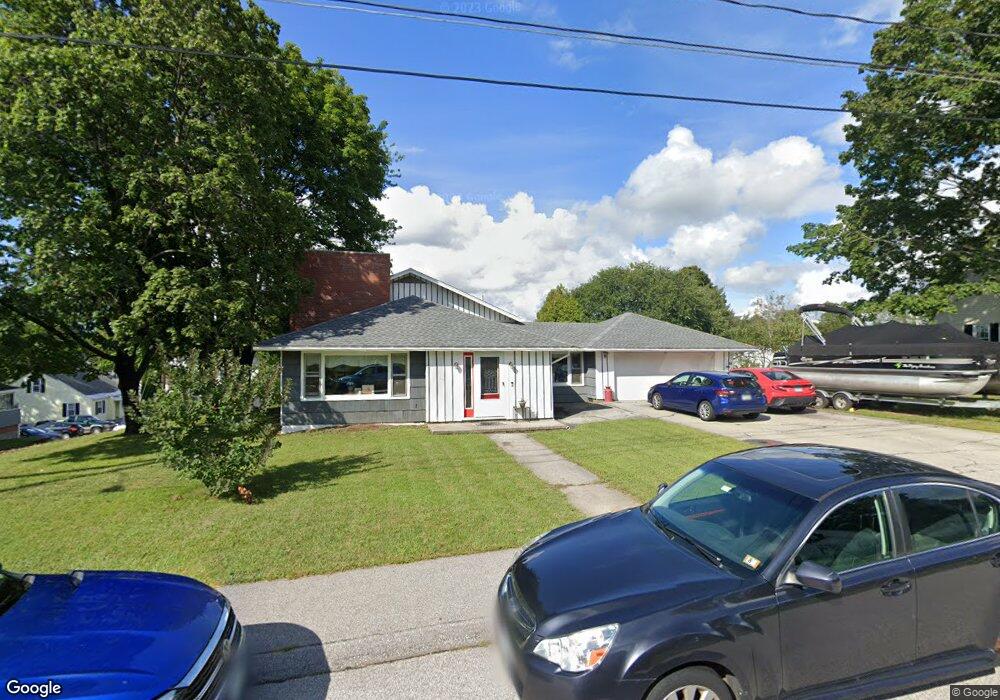
16 Cross St Allenstown, NH 03275
Suncook NeighborhoodEstimated Value: $385,000 - $452,542
2
Beds
2
Baths
2,147
Sq Ft
$191/Sq Ft
Est. Value
About This Home
This home is located at 16 Cross St, Allenstown, NH 03275 and is currently estimated at $410,386, approximately $191 per square foot. 16 Cross St is a home located in Merrimack County with nearby schools including Allenstown Elementary School, Armand R. Dupont School, and Tender Years Child Care & Learning Center.
Ownership History
Date
Name
Owned For
Owner Type
Purchase Details
Closed on
Jul 20, 2016
Sold by
Pepper Benjamin
Bought by
Pepper Amy L and Pepper Benjamin
Current Estimated Value
Home Financials for this Owner
Home Financials are based on the most recent Mortgage that was taken out on this home.
Original Mortgage
$163,000
Outstanding Balance
$130,207
Interest Rate
3.6%
Mortgage Type
New Conventional
Estimated Equity
$280,179
Purchase Details
Closed on
Jun 25, 2012
Sold by
Girard Henriette V
Bought by
Pepper Benjamin A
Create a Home Valuation Report for This Property
The Home Valuation Report is an in-depth analysis detailing your home's value as well as a comparison with similar homes in the area
Home Values in the Area
Average Home Value in this Area
Purchase History
| Date | Buyer | Sale Price | Title Company |
|---|---|---|---|
| Pepper Amy L | -- | -- | |
| Pepper Amy L | -- | -- | |
| Pepper Benjamin A | $155,000 | -- | |
| Pepper Benjamin A | $155,000 | -- |
Source: Public Records
Mortgage History
| Date | Status | Borrower | Loan Amount |
|---|---|---|---|
| Open | Pepper Amy L | $163,000 | |
| Closed | Pepper Amy L | $163,000 | |
| Closed | Pepper Benjamin A | $0 |
Source: Public Records
Tax History Compared to Growth
Tax History
| Year | Tax Paid | Tax Assessment Tax Assessment Total Assessment is a certain percentage of the fair market value that is determined by local assessors to be the total taxable value of land and additions on the property. | Land | Improvement |
|---|---|---|---|---|
| 2024 | $8,973 | $353,000 | $144,900 | $208,100 |
| 2023 | $7,484 | $353,000 | $144,900 | $208,100 |
| 2022 | $6,884 | $353,000 | $144,900 | $208,100 |
| 2021 | $6,451 | $204,800 | $82,100 | $122,700 |
| 2020 | $6,001 | $204,800 | $82,100 | $122,700 |
| 2019 | $6,369 | $204,800 | $82,100 | $122,700 |
| 2018 | $6,175 | $204,800 | $82,100 | $122,700 |
| 2017 | $6,576 | $204,800 | $82,100 | $122,700 |
| 2016 | $5,986 | $176,800 | $61,800 | $115,000 |
| 2015 | $5,804 | $176,800 | $61,800 | $115,000 |
| 2014 | $5,972 | $176,800 | $61,800 | $115,000 |
| 2013 | $5,575 | $176,800 | $61,800 | $115,000 |
Source: Public Records
Map
Nearby Homes
- 12 Theodore Ave
- 7 Ferry St
- 427 Dawn Dr Unit 15
- 422 Dawn Dr Unit 23
- 11 Letendre Ave
- 100 Main St Unit 312
- 100 Main St Unit M7
- 34-42 Glass St
- 111 Glass St
- 163-165 Main St
- 17 Prospect St
- 23 Bartlett St
- 1 Lane Dr
- 8 Sky View Terrace
- 189 Buck St
- 24 Parkwood Dr
- 10 Lane Dr
- 224 Pembroke St
- 2 Cheryl Dr
- 59 River Rd