
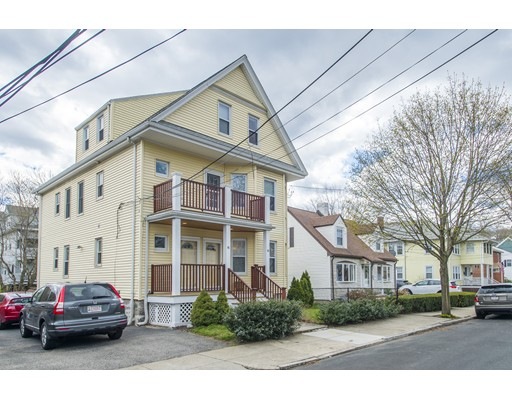
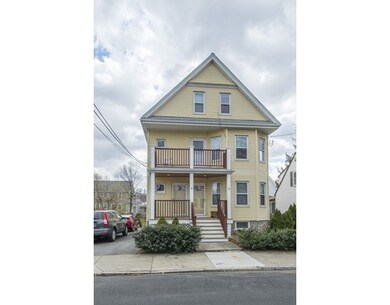


16 Donnybrook Rd Unit 18 Brighton, MA 02135
Brighton Neighborhood
5
Beds
3
Baths
3,030
Sq Ft
5,663
Sq Ft Lot
About This Home
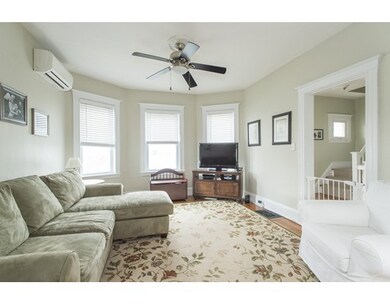
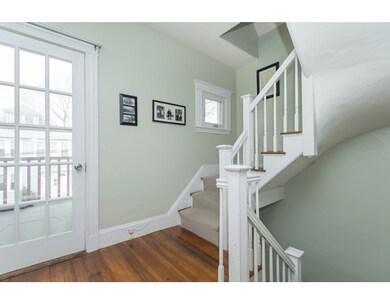
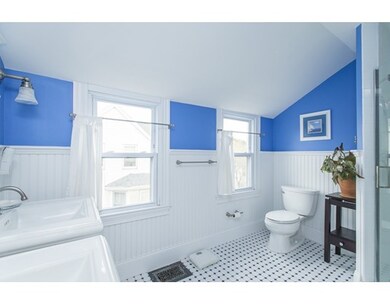
As of May 2024Don't miss this spectacular Philadelphia style two-family in Brighton's Oak Square! The property has been beautifully updated and maintained over the years. The extensive updates include newer heating systems, roof, back deck, and front deck. 3 zone ductless AC and central heat. Top floor includes large kitchen, dining room, living room, three large bedrooms, and two beautiful spacious bathrooms with tiled showers. First floor offers private entrance, living room, dining room, and separated bedrooms. Enjoy the summer days in the yard or on your private deck! Centrally located close to Oak Square, Brighton Center, Boston Landing, restaurants, Mass Pike / I-95. FIRST SHOWINGS AT OPEN HOUSE - 4/22 - 12:00-1:00 | 4/23 - 11-12:30 | 4/24 - 11:00-12:30
Property Details
Home Type
Multi-Family
Est. Annual Taxes
$13,913
Year Built
1905
Lot Details
0
Listing Details
- Lot Description: Paved Drive
- Property Type: Multi-family
- Other Agent: 1.00
- Lead Paint: Unknown
- Special Features: None
- Property Sub Type: MultiFamily
- Year Built: 1905
Interior Features
- Has Basement: Yes
- Number of Rooms: 12
- Amenities: Public Transportation, Shopping, Swimming Pool, Tennis Court, Park, Golf Course, Medical Facility, Bike Path
- Electric: 200 Amps, Individually Metered
- Flooring: Wood
- Basement: Full, Partially Finished, Walk Out
- Total Levels: 4
Exterior Features
- Roof: Asphalt/Fiberglass Shingles
- Construction: Frame
- Exterior: Clapboard
- Exterior Features: Deck, Storage Shed, Fenced Yard
- Foundation: Fieldstone
Garage/Parking
- Parking: Off-Street, Tandem, Paved Driveway
- Parking Spaces: 2
Utilities
- Cooling Zones: 3
- Heat Zones: 2
- Hot Water: Natural Gas
- Sewer: City/Town Sewer
- Water: City/Town Water
Condo/Co-op/Association
- Total Units: 2
Lot Info
- Zoning: 2F-5000
Multi Family
- Cooling Units: 3
- Heat Units: 2
- Common Room: Mudroom
- Total Bedrooms: 5
- Total Floors: 3
- Total Full Baths: 3
- Total Levels: 3
- Total Rms: 12
Ownership History
Date
Name
Owned For
Owner Type
Purchase Details
Listed on
Apr 20, 2016
Closed on
Jul 18, 2016
Sold by
Jennifer L Moy Ret
Bought by
Gill Kevin
Seller's Agent
Matt Palmer
Summit Residential
Buyer's Agent
David Murdock
Compass
List Price
$895,000
Sold Price
$917,500
Premium/Discount to List
$22,500
2.51%
Current Estimated Value
Home Financials for this Owner
Home Financials are based on the most recent Mortgage that was taken out on this home.
Estimated Appreciation
$433,981
Avg. Annual Appreciation
4.52%
Original Mortgage
$688,125
Interest Rate
3.66%
Mortgage Type
Unknown
Purchase Details
Closed on
Mar 16, 2016
Sold by
Moy Stephen D and Moy Jennifer L
Bought by
Jennifer L Moy Ret and Moy
Purchase Details
Closed on
Dec 14, 2010
Sold by
Moy Stephen
Bought by
Moy Stephen and Lane Jennifer
Home Financials for this Owner
Home Financials are based on the most recent Mortgage that was taken out on this home.
Original Mortgage
$213,000
Interest Rate
4.24%
Mortgage Type
Purchase Money Mortgage
Purchase Details
Closed on
Jun 18, 2004
Sold by
Keefe Jeannette T and Feefe David F
Bought by
Moy Stephen D
Purchase Details
Closed on
Oct 19, 1989
Sold by
Penticost Daniel W
Bought by
Keefe David F
Purchase Details
Closed on
Mar 13, 1987
Sold by
Kelleher Roger Est
Bought by
Penticost Daniel W
Similar Home in the area
Create a Home Valuation Report for This Property
The Home Valuation Report is an in-depth analysis detailing your home's value as well as a comparison with similar homes in the area
Home Values in the Area
Average Home Value in this Area
Purchase History
| Date | Type | Sale Price | Title Company |
|---|---|---|---|
| Not Resolvable | $917,500 | -- | |
| Deed | -- | -- | |
| Deed | -- | -- | |
| Deed | -- | -- | |
| Deed | -- | -- | |
| Deed | $659,000 | -- | |
| Deed | $659,000 | -- | |
| Deed | $265,000 | -- | |
| Deed | $165,000 | -- |
Source: Public Records
Mortgage History
| Date | Status | Loan Amount | Loan Type |
|---|---|---|---|
| Open | $680,000 | Stand Alone Refi Refinance Of Original Loan | |
| Closed | $800,000 | Purchase Money Mortgage | |
| Closed | $688,125 | Unknown | |
| Previous Owner | $196,000 | No Value Available | |
| Previous Owner | $213,000 | Purchase Money Mortgage |
Source: Public Records
Property History
| Date | Event | Price | Change | Sq Ft Price |
|---|---|---|---|---|
| 05/15/2024 05/15/24 | Sold | $1,350,000 | +4.2% | $446 / Sq Ft |
| 04/16/2024 04/16/24 | Pending | -- | -- | -- |
| 04/11/2024 04/11/24 | For Sale | $1,295,000 | +41.1% | $427 / Sq Ft |
| 07/19/2016 07/19/16 | Sold | $917,500 | +2.5% | $303 / Sq Ft |
| 04/26/2016 04/26/16 | Pending | -- | -- | -- |
| 04/20/2016 04/20/16 | For Sale | $895,000 | -- | $295 / Sq Ft |
Source: MLS Property Information Network (MLS PIN)
Tax History Compared to Growth
Tax History
| Year | Tax Paid | Tax Assessment Tax Assessment Total Assessment is a certain percentage of the fair market value that is determined by local assessors to be the total taxable value of land and additions on the property. | Land | Improvement |
|---|---|---|---|---|
| 2025 | $13,913 | $1,201,500 | $364,100 | $837,400 |
| 2024 | $12,361 | $1,134,000 | $340,900 | $793,100 |
| 2023 | $11,273 | $1,049,600 | $315,500 | $734,100 |
| 2022 | $10,672 | $980,900 | $294,900 | $686,000 |
| 2021 | $10,466 | $980,900 | $294,900 | $686,000 |
| 2020 | $10,118 | $958,100 | $268,100 | $690,000 |
| 2019 | $9,616 | $912,300 | $210,900 | $701,400 |
| 2018 | $9,017 | $860,400 | $210,900 | $649,500 |
| 2017 | $9,297 | $877,900 | $210,900 | $667,000 |
| 2016 | $8,623 | $783,900 | $210,900 | $573,000 |
| 2015 | $8,329 | $687,800 | $190,000 | $497,800 |
| 2014 | $7,393 | $587,700 | $190,000 | $397,700 |
Source: Public Records
Agents Affiliated with this Home
-
Seller's Agent in 2024
Jacob Eddy
Compass
(802) 779-4705
2 in this area
195 Total Sales
-
Buyer's Agent in 2024
Alina Wang
Coldwell Banker Realty - Lexington
(617) 678-2405
1 in this area
237 Total Sales
-
Seller's Agent in 2016
Matt Palmer
Summit Residential
(413) 262-4942
1 in this area
31 Total Sales
-
Buyer's Agent in 2016
David Murdock
Compass
(617) 828-7020
5 Total Sales
Map
Source: MLS Property Information Network (MLS PIN)
MLS Number: 71991466
APN: BRIG-000000-000022-003055
Disclaimer: Certain information contained herein is derived from information provided by parties other than Homes.com. All information provided is deemed reliable, but is not guaranteed to be accurate and should be independently verified.
![]() The property listing data and information, or the Images, set forth herein were provided to MLS Property Information Network, Inc. from third party sources, including sellers, lessors and public records, and were compiled by MLS Property Information Network, Inc. The property listing data and information, and the Images, are for the personal, non-commercial use of consumers having a good faith interest in purchasing or leasing listed properties of the type displayed to them and may not be used for any purpose other than to identify prospective properties which such consumers may have a good faith interest in purchasing or leasing. MLS Property Information Network, Inc. and its subscribers disclaim any and all representations and warranties as to the accuracy of the property listing data and information, or as to the accuracy of any of the Images, set forth herein.
The property listing data and information, or the Images, set forth herein were provided to MLS Property Information Network, Inc. from third party sources, including sellers, lessors and public records, and were compiled by MLS Property Information Network, Inc. The property listing data and information, and the Images, are for the personal, non-commercial use of consumers having a good faith interest in purchasing or leasing listed properties of the type displayed to them and may not be used for any purpose other than to identify prospective properties which such consumers may have a good faith interest in purchasing or leasing. MLS Property Information Network, Inc. and its subscribers disclaim any and all representations and warranties as to the accuracy of the property listing data and information, or as to the accuracy of any of the Images, set forth herein.
Nearby Homes
- 87-89 Bennett St
- 159 Parsons St
- 6 Brooksdale Rd Unit 6
- 71 Beechcroft St Unit 3
- 21 Upcrest Rd
- 165 Bigelow St
- 365 Faneuil St Unit 2
- 12 Bigelow Cir Unit 3
- 28 Adair Rd
- 11 Faneuil St
- 30 Dighton St
- 24-26 Bentley St
- 7 Cypress Rd Unit 706
- 160 Newton St Unit 2
- 25-27 Morrow Rd
- 214 Market St Unit 201
- 214 Market St Unit 202
- 70-72 Montcalm Ave
- 12 Mina Way
- 10 Mina Way