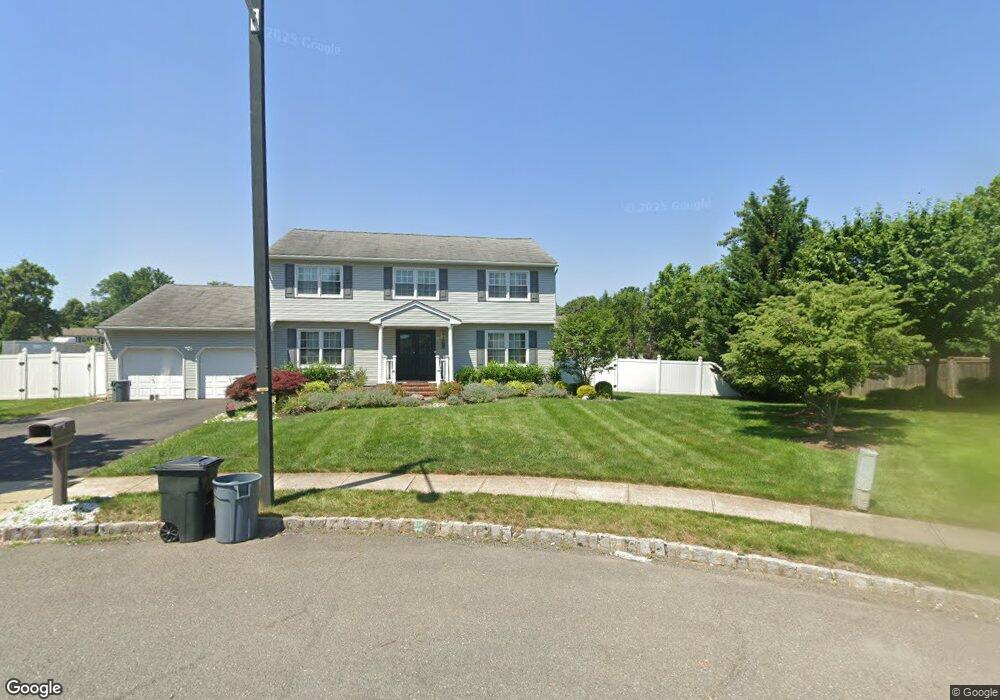
16 Dov Place Kendall Park, NJ 08824
Estimated Value: $796,522 - $1,000,000
5
Beds
3
Baths
2,793
Sq Ft
$307/Sq Ft
Est. Value
About This Home
This home is located at 16 Dov Place, Kendall Park, NJ 08824 and is currently estimated at $856,631, approximately $306 per square foot. 16 Dov Place is a home located in Middlesex County with nearby schools including Cambridge Elementary School, Crossroads South Middle School, and South Brunswick High School.
Ownership History
Date
Name
Owned For
Owner Type
Purchase Details
Closed on
Jan 5, 2017
Sold by
Vojjala Rajeshwar and Vojjala Praneeth
Bought by
Terranova Joella R and Terranova Christopher J
Current Estimated Value
Home Financials for this Owner
Home Financials are based on the most recent Mortgage that was taken out on this home.
Original Mortgage
$410,000
Outstanding Balance
$337,974
Interest Rate
4.13%
Mortgage Type
New Conventional
Estimated Equity
$518,657
Purchase Details
Closed on
Aug 16, 2007
Sold by
Gohel Rajendra P and Gohel Meera R
Bought by
Vojjala Rajeshwar and Vojjala Praneeth
Home Financials for this Owner
Home Financials are based on the most recent Mortgage that was taken out on this home.
Original Mortgage
$360,000
Interest Rate
6.71%
Mortgage Type
New Conventional
Create a Home Valuation Report for This Property
The Home Valuation Report is an in-depth analysis detailing your home's value as well as a comparison with similar homes in the area
Home Values in the Area
Average Home Value in this Area
Purchase History
| Date | Buyer | Sale Price | Title Company |
|---|---|---|---|
| Terranova Joella R | $532,500 | Premier Abstract & Title Age | |
| Vojjala Rajeshwar | $450,000 | -- |
Source: Public Records
Mortgage History
| Date | Status | Borrower | Loan Amount |
|---|---|---|---|
| Open | Terranova Joella R | $410,000 | |
| Previous Owner | Vojjala Rajeshwar | $360,000 |
Source: Public Records
Tax History Compared to Growth
Tax History
| Year | Tax Paid | Tax Assessment Tax Assessment Total Assessment is a certain percentage of the fair market value that is determined by local assessors to be the total taxable value of land and additions on the property. | Land | Improvement |
|---|---|---|---|---|
| 2025 | $11,763 | $232,100 | $82,400 | $149,700 |
| 2024 | $11,340 | $216,000 | $82,400 | $133,600 |
| 2023 | $11,340 | $216,000 | $82,400 | $133,600 |
| 2022 | $11,007 | $216,000 | $82,400 | $133,600 |
| 2021 | $8,466 | $216,000 | $82,400 | $133,600 |
| 2020 | $11,068 | $216,000 | $82,400 | $133,600 |
| 2019 | $11,165 | $216,000 | $82,400 | $133,600 |
| 2018 | $10,800 | $216,000 | $82,400 | $133,600 |
| 2017 | $10,783 | $216,000 | $82,400 | $133,600 |
| 2016 | $10,668 | $216,000 | $82,400 | $133,600 |
| 2015 | $10,344 | $216,000 | $82,400 | $133,600 |
| 2014 | $10,178 | $216,000 | $82,400 | $133,600 |
Source: Public Records
Map
Nearby Homes