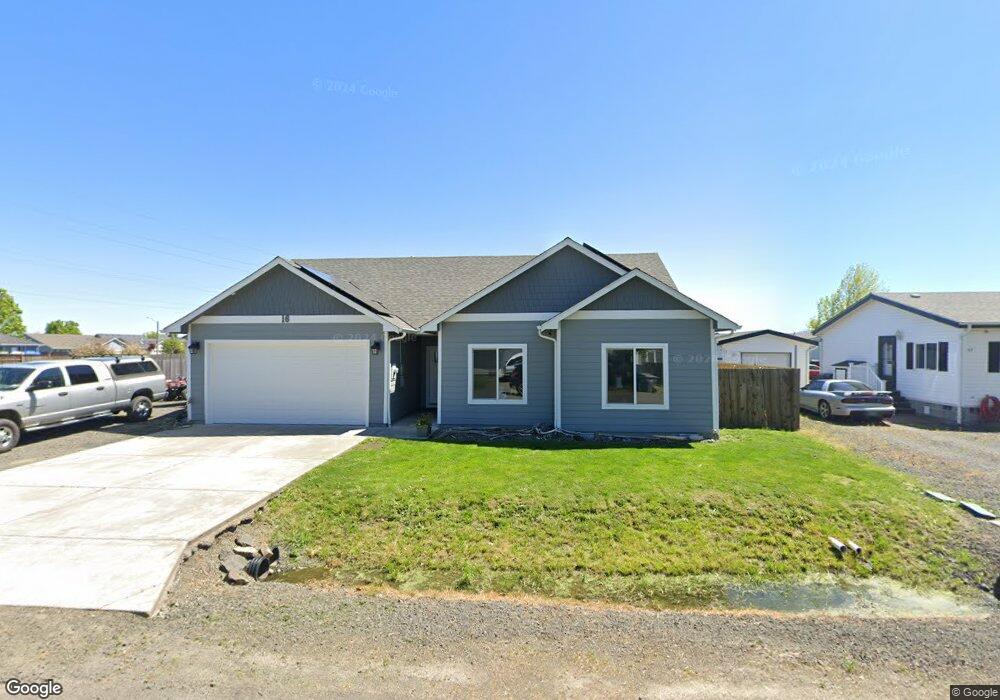
16 E 3rd St Halsey, OR 97348
Estimated Value: $406,072 - $411,000
3
Beds
2
Baths
1,548
Sq Ft
$264/Sq Ft
Est. Value
About This Home
This home is located at 16 E 3rd St, Halsey, OR 97348 and is currently estimated at $408,518, approximately $263 per square foot. 16 E 3rd St is a home with nearby schools including Central Linn Elementary School and Central Linn High School.
Ownership History
Date
Name
Owned For
Owner Type
Purchase Details
Closed on
Mar 14, 2018
Sold by
Jones N
Bought by
Jones William and Jones Tina M
Current Estimated Value
Purchase Details
Closed on
Jan 4, 2018
Sold by
Smith Donna R and Kuhn Donna R
Bought by
Jones William S and Jones Tina M
Purchase Details
Closed on
Jan 3, 2018
Sold by
Jones W Neel
Bought by
Jones William S and Jones Tina M
Create a Home Valuation Report for This Property
The Home Valuation Report is an in-depth analysis detailing your home's value as well as a comparison with similar homes in the area
Purchase History
| Date | Buyer | Sale Price | Title Company |
|---|---|---|---|
| Jones William | -- | Ticor Title | |
| Jones William | -- | Ticor Title | |
| Jones William S | -- | Ticor Title | |
| Jones William S | -- | Ticor Title |
Source: Public Records
Tax History
| Year | Tax Paid | Tax Assessment Tax Assessment Total Assessment is a certain percentage of the fair market value that is determined by local assessors to be the total taxable value of land and additions on the property. | Land | Improvement |
|---|---|---|---|---|
| 2025 | $3,946 | $228,560 | -- | -- |
| 2024 | $3,840 | $221,910 | -- | -- |
| 2023 | $3,735 | $215,450 | $0 | $0 |
| 2022 | $3,635 | $209,180 | $0 | $0 |
| 2021 | $3,492 | $203,090 | $0 | $0 |
| 2020 | $3,428 | $197,180 | $0 | $0 |
| 2019 | $3,330 | $191,440 | $0 | $0 |
| 2018 | $638 | $36,550 | $0 | $0 |
| 2017 | $619 | $35,490 | $0 | $0 |
| 2016 | $608 | $34,460 | $0 | $0 |
| 2015 | $592 | $33,460 | $0 | $0 |
| 2014 | $567 | $32,490 | $0 | $0 |
Source: Public Records
Map
Nearby Homes
Your Personal Tour Guide
Ask me questions while you tour the home.