Estimated Value: $204,567 - $245,000
2
Beds
1
Bath
999
Sq Ft
$232/Sq Ft
Est. Value
About This Home
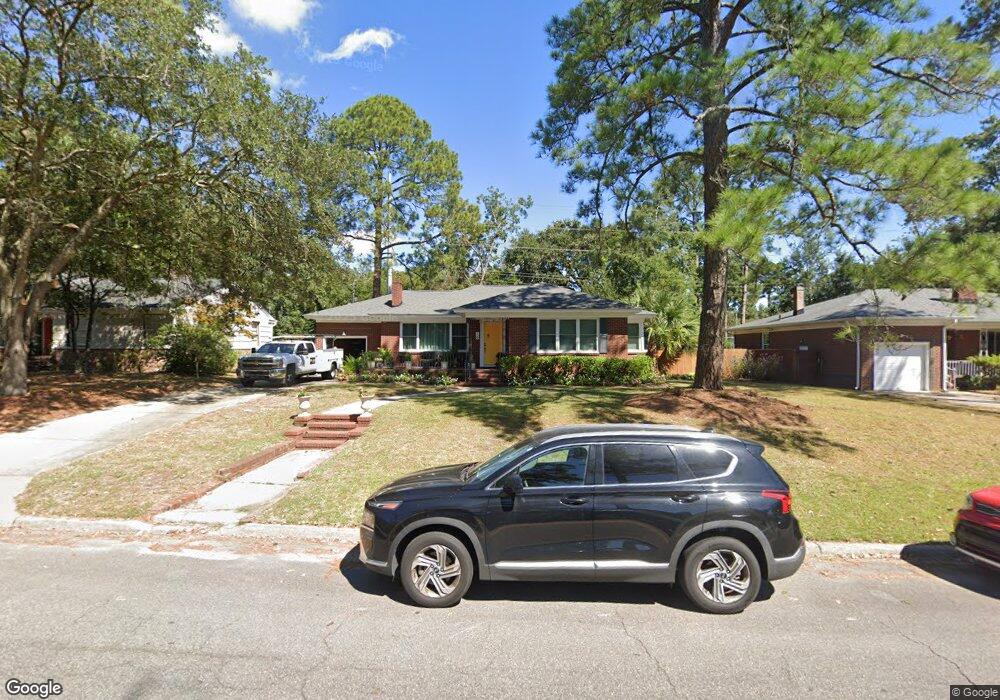
This home is located at 16 E 61st St, Savannah, GA 31405 and is currently estimated at $231,892, approximately $232 per square foot. 16 E 61st St is a home located in Chatham County with nearby schools including Jacob G. Smith Elementary School, Myers Middle School, and Beach High School.
Ownership History
Date
Name
Owned For
Owner Type
Purchase Details
Closed on
Sep 3, 2020
Sold by
Bongiovanni Properties 1 Llc
Bought by
Fisher Elizabeth Nicole
Current Estimated Value
Home Financials for this Owner
Home Financials are based on the most recent Mortgage that was taken out on this home.
Original Mortgage
$129,200
Outstanding Balance
$113,385
Interest Rate
2.8%
Mortgage Type
New Conventional
Estimated Equity
$118,507
Purchase Details
Closed on
Aug 30, 2019
Sold by
Bowen Family Investments Llc
Bought by
Bongiovanni Properties 1 Llc
Purchase Details
Closed on
Feb 29, 2008
Sold by
Not Provided
Bought by
Bowen Fam Investments Llc
Create a Home Valuation Report for This Property
The Home Valuation Report is an in-depth analysis detailing your home's value as well as a comparison with similar homes in the area
Home Values in the Area
Average Home Value in this Area
Purchase History
| Date | Buyer | Sale Price | Title Company |
|---|---|---|---|
| Fisher Elizabeth Nicole | $136,000 | -- | |
| Bongiovanni Properties 1 Llc | -- | -- | |
| Bowen Fam Investments Llc | $52,000 | -- |
Source: Public Records
Mortgage History
| Date | Status | Borrower | Loan Amount |
|---|---|---|---|
| Open | Fisher Elizabeth Nicole | $129,200 |
Source: Public Records
Tax History
| Year | Tax Paid | Tax Assessment Tax Assessment Total Assessment is a certain percentage of the fair market value that is determined by local assessors to be the total taxable value of land and additions on the property. | Land | Improvement |
|---|---|---|---|---|
| 2025 | $247 | $118,520 | $1,840 | $116,680 |
| 2024 | $2 | $130,160 | $1,840 | $128,320 |
| 2023 | $286 | $99,480 | $1,840 | $97,640 |
| 2022 | $487 | $58,040 | $1,120 | $56,920 |
| 2021 | $664 | $49,280 | $880 | $48,400 |
| 2020 | $692 | $21,920 | $480 | $21,440 |
| 2019 | $974 | $21,920 | $480 | $21,440 |
| 2018 | $815 | $18,120 | $480 | $17,640 |
| 2017 | $780 | $18,680 | $600 | $18,080 |
| 2016 | $544 | $18,760 | $600 | $18,160 |
| 2015 | $806 | $19,320 | $600 | $18,720 |
| 2014 | $1,088 | $19,680 | $0 | $0 |
Source: Public Records
Map
Nearby Homes
Your Personal Tour Guide
Ask me questions while you tour the home.