16 E Park St Johnston, RI 02919
Thornton NeighborhoodEstimated Value: $436,516 - $498,000
3
Beds
2
Baths
1,536
Sq Ft
$307/Sq Ft
Est. Value
About This Home
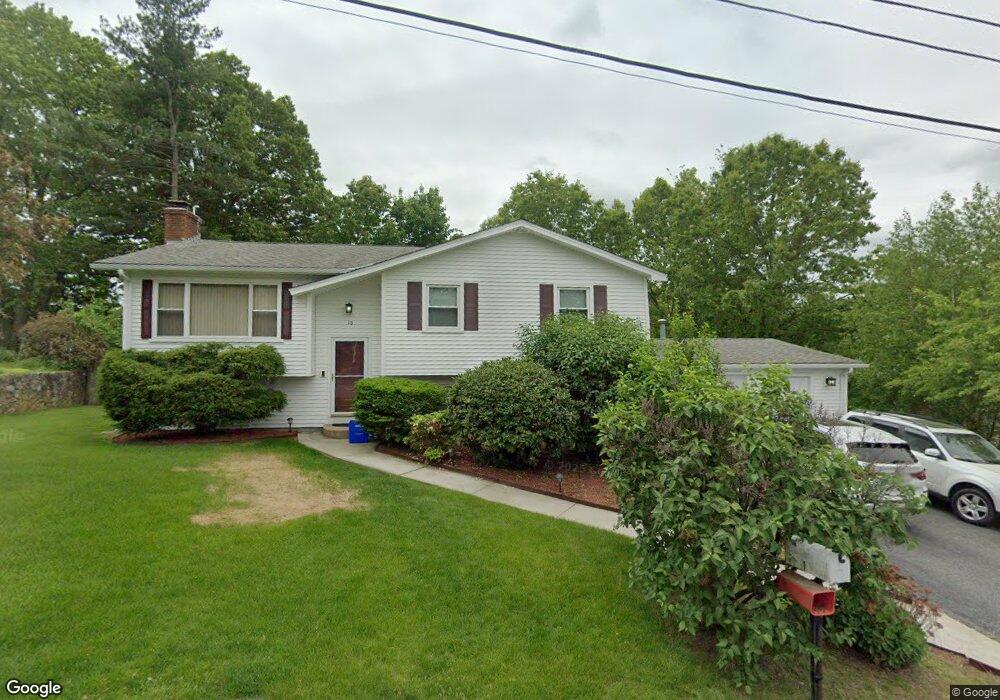
This home is located at 16 E Park St, Johnston, RI 02919 and is currently estimated at $472,129, approximately $307 per square foot. 16 E Park St is a home located in Providence County with nearby schools including Johnston Senior High School and St Rocco School.
Ownership History
Date
Name
Owned For
Owner Type
Purchase Details
Closed on
Sep 25, 2024
Sold by
Dicarlo Donna P
Bought by
Donna P Dicarlo Ret and Dicarlo
Current Estimated Value
Purchase Details
Closed on
Apr 13, 1993
Sold by
Babbitt Gary M
Bought by
Delvecchio Paul D and Delvecchio Donna
Home Financials for this Owner
Home Financials are based on the most recent Mortgage that was taken out on this home.
Original Mortgage
$86,400
Interest Rate
7.48%
Mortgage Type
Purchase Money Mortgage
Create a Home Valuation Report for This Property
The Home Valuation Report is an in-depth analysis detailing your home's value as well as a comparison with similar homes in the area
Home Values in the Area
Average Home Value in this Area
Purchase History
| Date | Buyer | Sale Price | Title Company |
|---|---|---|---|
| Donna P Dicarlo Ret | -- | None Available | |
| Donna P Dicarlo Ret | -- | None Available | |
| Delvecchio Paul D | $110,000 | -- |
Source: Public Records
Mortgage History
| Date | Status | Borrower | Loan Amount |
|---|---|---|---|
| Previous Owner | Delvecchio Paul D | $86,400 |
Source: Public Records
Tax History
| Year | Tax Paid | Tax Assessment Tax Assessment Total Assessment is a certain percentage of the fair market value that is determined by local assessors to be the total taxable value of land and additions on the property. | Land | Improvement |
|---|---|---|---|---|
| 2025 | $5,692 | $364,400 | $89,600 | $274,800 |
| 2024 | $5,575 | $364,400 | $89,600 | $274,800 |
| 2023 | $5,575 | $364,400 | $89,600 | $274,800 |
| 2022 | $5,255 | $226,100 | $66,400 | $159,700 |
| 2021 | $5,255 | $226,100 | $66,400 | $159,700 |
| 2018 | $5,355 | $194,800 | $49,400 | $145,400 |
| 2016 | $7,085 | $194,800 | $49,400 | $145,400 |
| 2015 | $5,056 | $174,400 | $49,900 | $124,500 |
| 2014 | $5,014 | $174,400 | $49,900 | $124,500 |
| 2013 | $5,014 | $174,400 | $49,900 | $124,500 |
Source: Public Records
Map
Nearby Homes
Your Personal Tour Guide
Ask me questions while you tour the home.