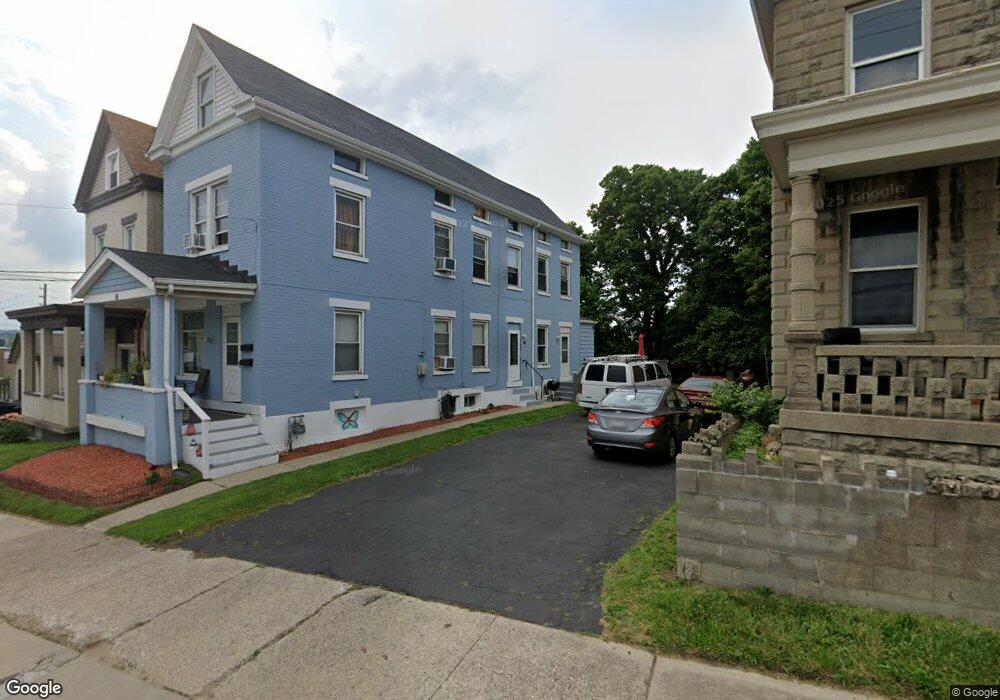
16 E Ross Ave Cincinnati, OH 45217
Estimated Value: $160,000 - $192,457
2
Beds
2
Baths
1,824
Sq Ft
$100/Sq Ft
Est. Value
About This Home
This home is located at 16 E Ross Ave, Cincinnati, OH 45217 and is currently estimated at $181,864, approximately $99 per square foot. 16 E Ross Ave is a home located in Hamilton County with nearby schools including St Bernard Elementary School, St Bernard-Elmwood Place High School, and Horizon Science Academy-Cincinnati.
Ownership History
Date
Name
Owned For
Owner Type
Purchase Details
Closed on
May 3, 2024
Sold by
Fox Michael and Fox Tina
Bought by
Streaker Naomi R
Current Estimated Value
Home Financials for this Owner
Home Financials are based on the most recent Mortgage that was taken out on this home.
Original Mortgage
$142,373
Outstanding Balance
$139,805
Interest Rate
6.79%
Mortgage Type
FHA
Estimated Equity
$42,059
Purchase Details
Closed on
Apr 27, 2007
Sold by
Lynch Tina Marie and Fox Tina
Bought by
Fox Michael and Fox Tina
Home Financials for this Owner
Home Financials are based on the most recent Mortgage that was taken out on this home.
Original Mortgage
$104,000
Interest Rate
6.22%
Mortgage Type
New Conventional
Create a Home Valuation Report for This Property
The Home Valuation Report is an in-depth analysis detailing your home's value as well as a comparison with similar homes in the area
Home Values in the Area
Average Home Value in this Area
Purchase History
| Date | Buyer | Sale Price | Title Company |
|---|---|---|---|
| Streaker Naomi R | $146,000 | Prodigy Title | |
| Fox Michael | -- | Vintage Title Agency Inc |
Source: Public Records
Mortgage History
| Date | Status | Borrower | Loan Amount |
|---|---|---|---|
| Open | Streaker Naomi R | $142,373 | |
| Previous Owner | Fox Michael | $104,000 |
Source: Public Records
Tax History
| Year | Tax Paid | Tax Assessment Tax Assessment Total Assessment is a certain percentage of the fair market value that is determined by local assessors to be the total taxable value of land and additions on the property. | Land | Improvement |
|---|---|---|---|---|
| 2025 | $3,107 | $50,561 | $11,578 | $38,983 |
| 2023 | $3,233 | $50,561 | $11,578 | $38,983 |
| 2022 | $2,137 | $26,030 | $9,030 | $17,000 |
| 2021 | $2,129 | $26,030 | $9,030 | $17,000 |
| 2020 | $2,051 | $26,030 | $9,030 | $17,000 |
| 2019 | $1,916 | $22,247 | $7,718 | $14,529 |
| 2018 | $1,945 | $22,247 | $7,718 | $14,529 |
| 2017 | $1,827 | $22,247 | $7,718 | $14,529 |
| 2016 | $1,626 | $19,608 | $9,090 | $10,518 |
| 2015 | $1,438 | $19,608 | $9,090 | $10,518 |
| 2014 | $1,437 | $19,608 | $9,090 | $10,518 |
| 2013 | $1,471 | $20,640 | $9,569 | $11,071 |
Source: Public Records
Map
Nearby Homes
- 218 Washington Ave
- 320 Mcclelland Ave
- 27 Phillips Ave
- 44 Baker Ave
- 421 Jefferson Ave
- 5128 Imwalle Ave
- 4546 Leo St
- 710 E Ross Ave
- 4525 Vine St
- 5140 1/2 Imwalle Ave
- 4251 Leonard Ave
- 4238 Leonard Ave
- 4905 Chalet Dr
- 4903 Chalet Dr
- 318 E Mitchell Ave
- 4901 Chalet Dr
- 4908 Chalet Dr
- 4900 Chalet Dr
- 4259 Vine St
- 36 Wuest St
Your Personal Tour Guide
Ask me questions while you tour the home.