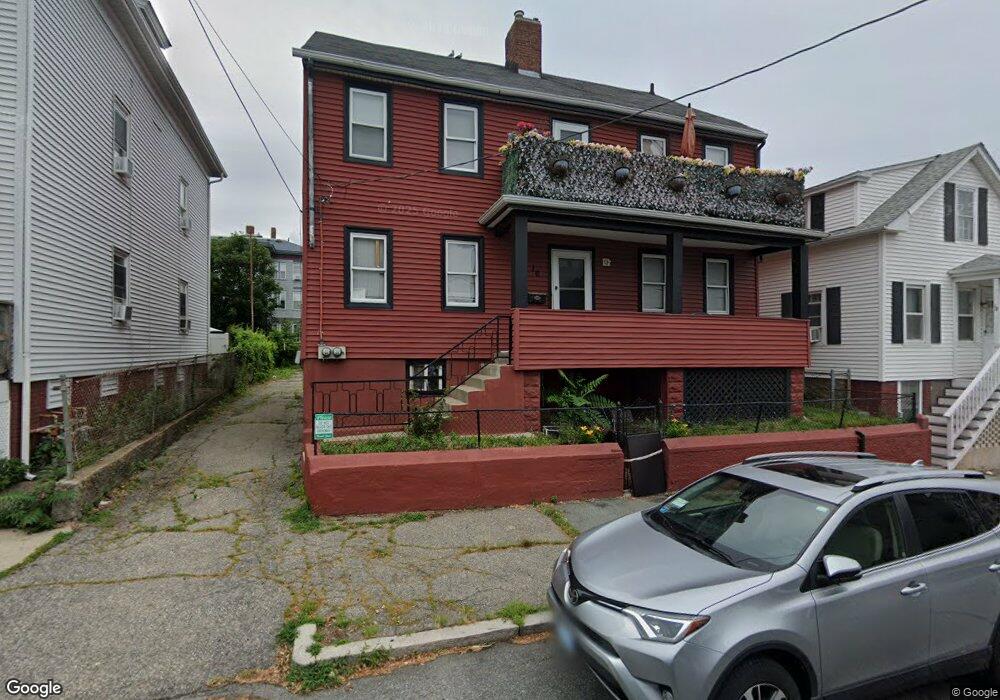
16 E Transit St Providence, RI 02906
Fox Point NeighborhoodEstimated Value: $759,000 - $846,905
5
Beds
2
Baths
1,904
Sq Ft
$415/Sq Ft
Est. Value
About This Home
This home is located at 16 E Transit St, Providence, RI 02906 and is currently estimated at $789,635, approximately $414 per square foot. 16 E Transit St is a home located in Providence County with nearby schools including French-American School of Rhode Island, Wheeler School, and Moses Brown School.
Ownership History
Date
Name
Owned For
Owner Type
Purchase Details
Closed on
Feb 18, 1992
Sold by
Torres Miguel
Bought by
Chen Tian Min
Current Estimated Value
Home Financials for this Owner
Home Financials are based on the most recent Mortgage that was taken out on this home.
Original Mortgage
$90,250
Interest Rate
8.18%
Create a Home Valuation Report for This Property
The Home Valuation Report is an in-depth analysis detailing your home's value as well as a comparison with similar homes in the area
Home Values in the Area
Average Home Value in this Area
Purchase History
| Date | Buyer | Sale Price | Title Company |
|---|---|---|---|
| Chen Tian Min | $95,000 | -- | |
| Chen Tian Min | $95,000 | -- |
Source: Public Records
Mortgage History
| Date | Status | Borrower | Loan Amount |
|---|---|---|---|
| Closed | Chen Tian Min | $90,250 |
Source: Public Records
Tax History
| Year | Tax Paid | Tax Assessment Tax Assessment Total Assessment is a certain percentage of the fair market value that is determined by local assessors to be the total taxable value of land and additions on the property. | Land | Improvement |
|---|---|---|---|---|
| 2025 | $5,891 | $780,300 | $445,500 | $334,800 |
| 2024 | $10,682 | $582,100 | $340,200 | $241,900 |
| 2023 | $10,682 | $582,100 | $340,200 | $241,900 |
| 2022 | $10,361 | $582,100 | $340,200 | $241,900 |
| 2021 | $9,488 | $386,300 | $225,200 | $161,100 |
| 2020 | $9,488 | $386,300 | $225,200 | $161,100 |
| 2019 | $9,488 | $386,300 | $225,200 | $161,100 |
| 2018 | $10,112 | $316,400 | $207,700 | $108,700 |
| 2017 | $10,112 | $316,400 | $207,700 | $108,700 |
| 2016 | $10,112 | $316,400 | $207,700 | $108,700 |
| 2015 | $9,582 | $289,500 | $207,700 | $81,800 |
| 2014 | $9,518 | $282,000 | $207,700 | $74,300 |
| 2013 | $9,518 | $282,000 | $207,700 | $74,300 |
Source: Public Records
Map
Nearby Homes
- 42 E Transit St
- 20 Governor St
- 42 Fremont St
- 16 Governor St
- 427 Wickenden St
- 670 Wickenden St
- 374 Wickenden St
- 185 Transit St
- 14 Amy St
- 18 Amy St
- 323 Wickenden St
- 45 E George St
- 165 Waterman St Unit 2
- 84 Transit St
- 124 Pitman St
- 355 Angell St Unit 7
- 555 S Main St Unit 321
- 38 Transit St Unit 3
- 555 S Water St Unit 212
- 400 Angell St
- 18 E Transit St
- 22 E Transit St
- 11 Fremont St
- 13 Fremont St
- 8 E Transit St
- 24 E Transit St
- 24 E Transit St Unit 2
- 15 E Transit St
- 15 E Transit St Unit 1
- 49 Governor St Unit 1
- 19 Fremont St
- 53 Governor St Unit 3
- 53 Governor St Unit 2
- 53 Governor St Unit 1
- 28 E Transit St
- 28 E Transit St Unit 3
- 28 E Transit St Unit 2
- 28 E Transit St Unit 1
- 43 Governor St
- 23 E Transit St Unit 2nd
Your Personal Tour Guide
Ask me questions while you tour the home.