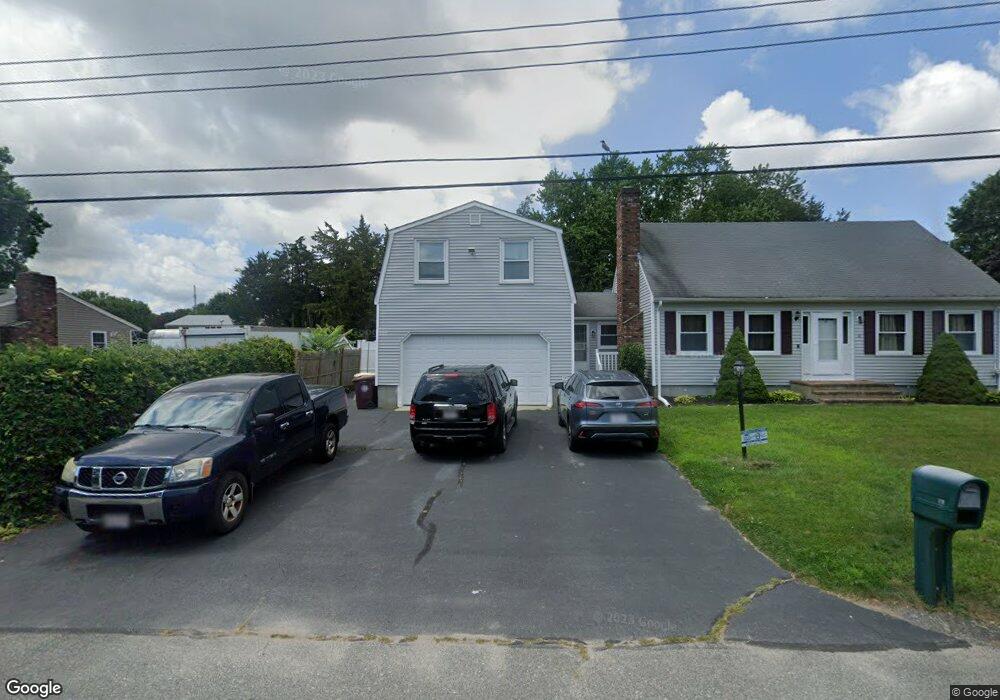
16 Elaine Way Acushnet, MA 02743
Estimated Value: $549,521 - $637,000
5
Beds
2
Baths
2,121
Sq Ft
$285/Sq Ft
Est. Value
About This Home
This home is located at 16 Elaine Way, Acushnet, MA 02743 and is currently estimated at $605,130, approximately $285 per square foot. 16 Elaine Way is a home located in Bristol County with nearby schools including Acushnet Elementary School, Albert F Ford Middle School, and Alma Del Mar Charter School.
Ownership History
Date
Name
Owned For
Owner Type
Purchase Details
Closed on
Sep 18, 2009
Sold by
Us Bk
Bought by
Plante Steven
Current Estimated Value
Purchase Details
Closed on
Apr 14, 2009
Sold by
Davignon Kevin and Us Bk
Bought by
Us Bk
Purchase Details
Closed on
Aug 12, 1998
Sold by
Davignon Diane H
Bought by
Davignon Kevin and Davignon Ronald
Purchase Details
Closed on
Apr 12, 1988
Sold by
Cresswell Norman
Bought by
Davignon Diane H
Create a Home Valuation Report for This Property
The Home Valuation Report is an in-depth analysis detailing your home's value as well as a comparison with similar homes in the area
Home Values in the Area
Average Home Value in this Area
Purchase History
| Date | Buyer | Sale Price | Title Company |
|---|---|---|---|
| Plante Steven | $180,000 | -- | |
| Us Bk | $188,250 | -- | |
| Davignon Kevin | $155,000 | -- | |
| Davignon Diane H | $165,000 | -- |
Source: Public Records
Mortgage History
| Date | Status | Borrower | Loan Amount |
|---|---|---|---|
| Previous Owner | Davignon Diane H | $328,000 | |
| Previous Owner | Davignon Diane H | $294,000 | |
| Previous Owner | Davignon Diane H | $50,000 |
Source: Public Records
Tax History Compared to Growth
Tax History
| Year | Tax Paid | Tax Assessment Tax Assessment Total Assessment is a certain percentage of the fair market value that is determined by local assessors to be the total taxable value of land and additions on the property. | Land | Improvement |
|---|---|---|---|---|
| 2025 | $5,276 | $489,000 | $122,800 | $366,200 |
| 2024 | $5,025 | $440,400 | $116,400 | $324,000 |
| 2023 | $5,101 | $425,100 | $105,600 | $319,500 |
| 2022 | $5,045 | $380,200 | $99,100 | $281,100 |
| 2021 | $4,727 | $335,600 | $99,100 | $236,500 |
| 2020 | $4,589 | $329,200 | $92,700 | $236,500 |
| 2019 | $4,414 | $311,300 | $88,400 | $222,900 |
| 2018 | $3,970 | $295,700 | $88,400 | $207,300 |
| 2017 | $4,136 | $286,400 | $88,400 | $198,000 |
| 2016 | $4,215 | $290,100 | $88,400 | $201,700 |
| 2015 | $3,858 | $270,200 | $88,400 | $181,800 |
Source: Public Records
Map
Nearby Homes