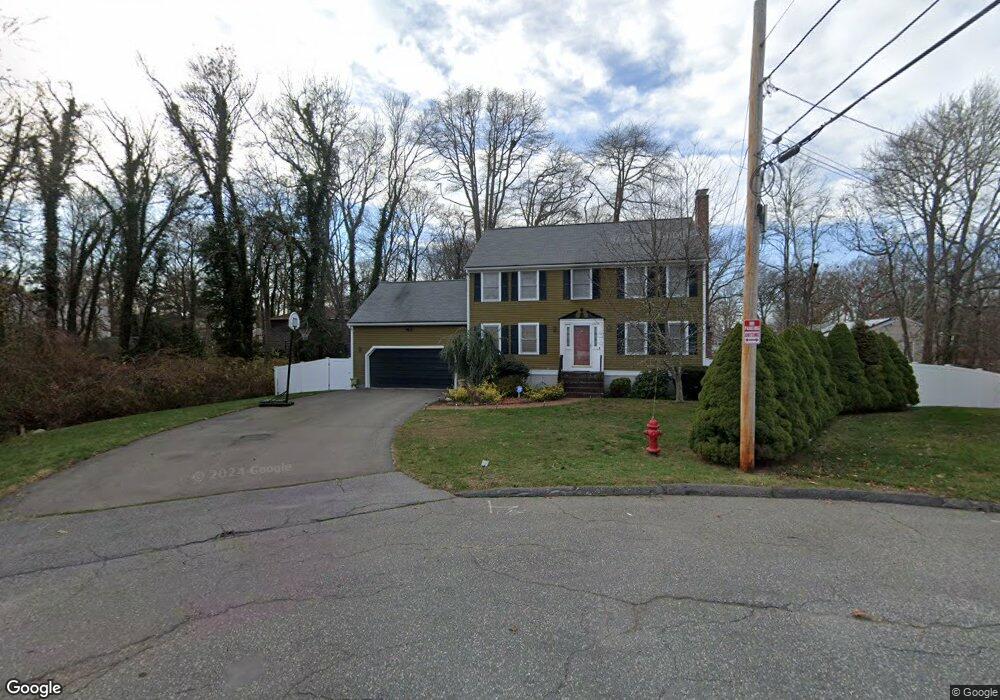
16 Elgin Ct Randolph, MA 02368
Downtown Randolph NeighborhoodEstimated Value: $685,000 - $741,000
3
Beds
3
Baths
1,872
Sq Ft
$384/Sq Ft
Est. Value
About This Home
This home is located at 16 Elgin Ct, Randolph, MA 02368 and is currently estimated at $719,240, approximately $384 per square foot. 16 Elgin Ct is a home located in Norfolk County with nearby schools including Randolph High School and Lighthouse Baptist Christian Academy.
Ownership History
Date
Name
Owned For
Owner Type
Purchase Details
Closed on
Jul 29, 1994
Sold by
Shiavone & Sons Constr
Bought by
Conrad Mark A and Conrad Vickie E
Current Estimated Value
Home Financials for this Owner
Home Financials are based on the most recent Mortgage that was taken out on this home.
Original Mortgage
$171,000
Interest Rate
8.25%
Mortgage Type
Purchase Money Mortgage
Create a Home Valuation Report for This Property
The Home Valuation Report is an in-depth analysis detailing your home's value as well as a comparison with similar homes in the area
Home Values in the Area
Average Home Value in this Area
Purchase History
| Date | Buyer | Sale Price | Title Company |
|---|---|---|---|
| Conrad Mark A | $180,000 | -- |
Source: Public Records
Mortgage History
| Date | Status | Borrower | Loan Amount |
|---|---|---|---|
| Open | Conrad Mark A | $200,000 | |
| Closed | Conrad Mark A | $171,000 |
Source: Public Records
Tax History
| Year | Tax Paid | Tax Assessment Tax Assessment Total Assessment is a certain percentage of the fair market value that is determined by local assessors to be the total taxable value of land and additions on the property. | Land | Improvement |
|---|---|---|---|---|
| 2025 | $7,618 | $656,200 | $265,900 | $390,300 |
| 2024 | $7,276 | $635,500 | $260,600 | $374,900 |
| 2023 | $7,206 | $596,500 | $237,000 | $359,500 |
| 2022 | $6,661 | $489,800 | $197,500 | $292,300 |
| 2021 | $6,438 | $435,600 | $164,400 | $271,200 |
| 2020 | $6,291 | $421,900 | $164,400 | $257,500 |
| 2019 | $6,149 | $410,500 | $156,800 | $253,700 |
| 2018 | $6,281 | $395,500 | $142,500 | $253,000 |
| 2017 | $6,356 | $392,800 | $135,600 | $257,200 |
| 2016 | $6,252 | $359,500 | $123,400 | $236,100 |
| 2015 | $5,977 | $330,200 | $117,400 | $212,800 |
Source: Public Records
Map
Nearby Homes
- 7 Van Beal Rd
- 6 Eagle Rd
- 33 Hemlock Terrace
- 54 Highland Glen Dr
- 59 Highland Glen Dr Unit 328
- 159 Bittersweet Ln Unit 107
- 158 Union St
- 71 Cole Terrace
- 23 Nightingale Cir
- 20 Selwyn Rd
- 28 Mcdonnell Dr
- 43 West St Unit A2
- 10 Alfred Terrace
- 153 West St
- 17 Mazzeo Dr
- 217 Mill St
- 15 Hillsdale Rd
- 229 Mill St
- 249 Mill St
- 5 Patterson Ave E
Your Personal Tour Guide
Ask me questions while you tour the home.