
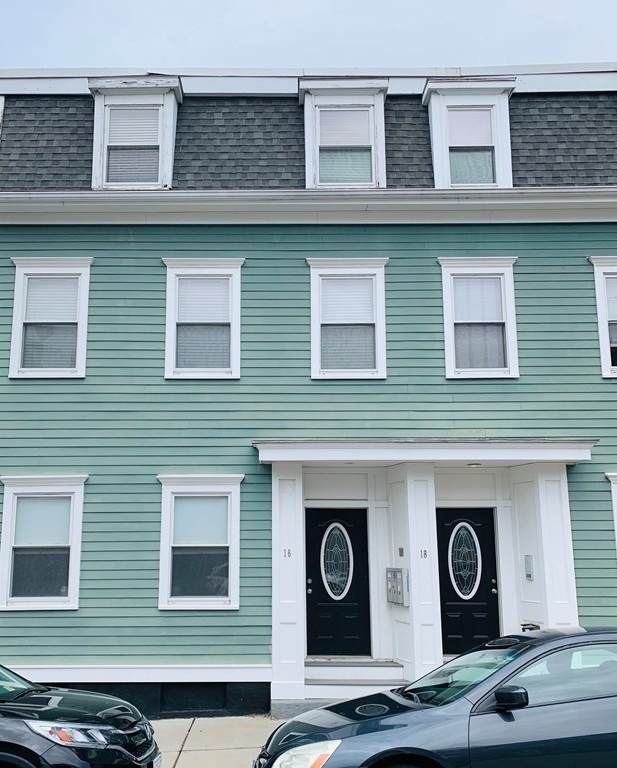

16 Emerson St Unit 1 Boston, MA 02127
South Boston Neighborhood
1
Bed
1
Bath
536
Sq Ft
436
Sq Ft Lot
About This Home
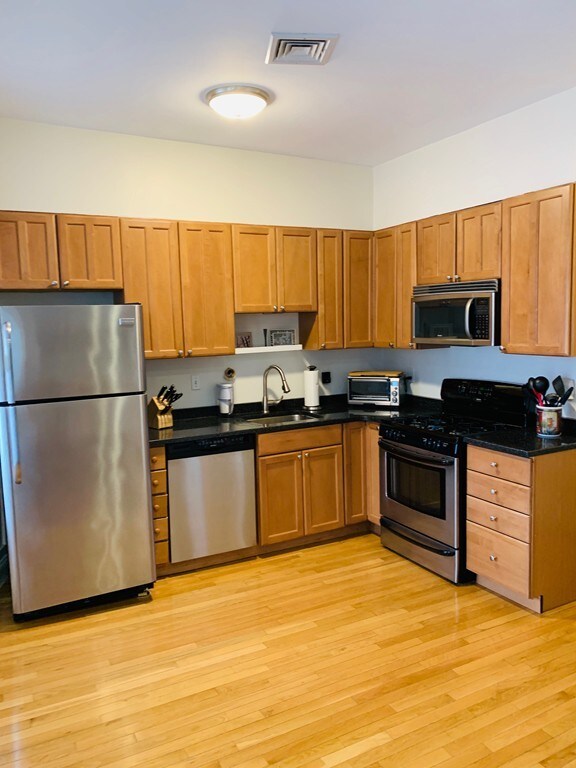
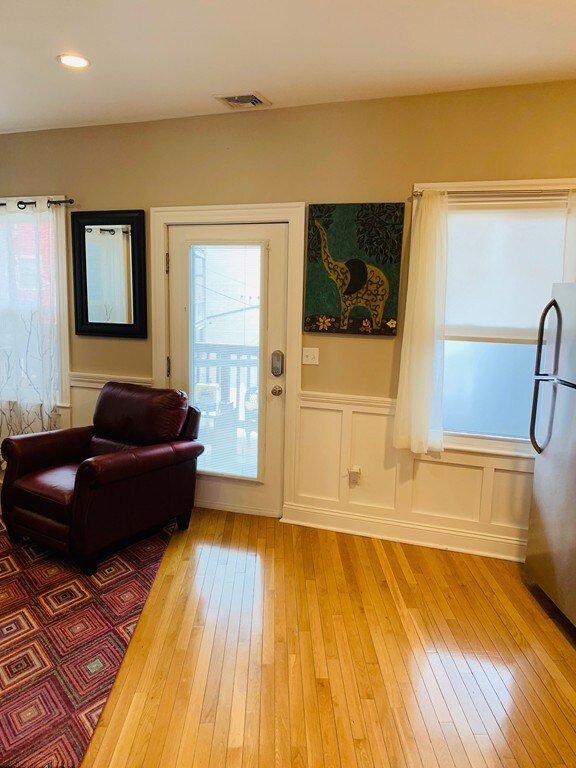
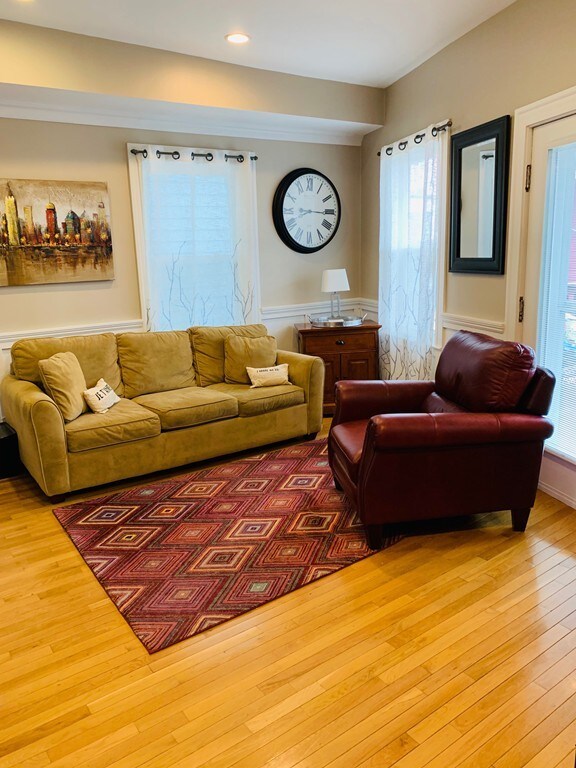
As of June 2019The heart of Southie! Around the corner from restaurants and bars! Close to Castle Island and South Boston beaches. This immaculate 1 bedroom condo has gleaming wood floors throughout, updated kitchen with granite counter tops and stainless steel appliances. Enjoy the built in shelves in the living room with electric fireplace. A well sized private back deck and fenced in common space below, makes the location stand out from the rest. Worried about storage space? Don't be - there is a large, private storage room in the finished basement.
Last Agent to Sell the Property
Sara Hazel
Keller Williams Coastal Realty License #449591166 Listed on: 04/21/2019
Property Details
Home Type
- Condominium
Est. Annual Taxes
- $5,469
Year Built
- Built in 1890
Property Views
- Harbor Views
Kitchen
- Range
- Microwave
- Dishwasher
Laundry
- Dryer
- Washer
Utilities
- Central Air
- Hot Water Baseboard Heater
- Heating System Uses Gas
Additional Features
- Basement
Community Details
- Pets Allowed
Listing and Financial Details
- Assessor Parcel Number W:06 P:03065 S:002
Ownership History
Date
Name
Owned For
Owner Type
Purchase Details
Listed on
Apr 21, 2019
Closed on
Jun 19, 2019
Sold by
Seyller Sharon and Catteau Kelly
Bought by
Amsalem Annie M
Seller's Agent
Sara Hazel
Keller Williams Coastal Realty
Buyer's Agent
617 Living
Compass
List Price
$489,900
Sold Price
$475,000
Premium/Discount to List
-$14,900
-3.04%
Home Financials for this Owner
Home Financials are based on the most recent Mortgage that was taken out on this home.
Avg. Annual Appreciation
1.13%
Original Mortgage
$356,250
Interest Rate
4.1%
Mortgage Type
New Conventional
Purchase Details
Closed on
Jun 27, 2017
Sold by
Dunham Gregory J
Bought by
Seyller Sharon and Carreau Kelly
Home Financials for this Owner
Home Financials are based on the most recent Mortgage that was taken out on this home.
Original Mortgage
$408,370
Interest Rate
4.05%
Mortgage Type
New Conventional
Purchase Details
Closed on
Feb 8, 2007
Sold by
Edwards James
Bought by
Dunham Gregory J
Home Financials for this Owner
Home Financials are based on the most recent Mortgage that was taken out on this home.
Original Mortgage
$188,000
Interest Rate
6.22%
Mortgage Type
Purchase Money Mortgage
Similar Homes in the area
Create a Home Valuation Report for This Property
The Home Valuation Report is an in-depth analysis detailing your home's value as well as a comparison with similar homes in the area
Home Values in the Area
Average Home Value in this Area
Purchase History
| Date | Type | Sale Price | Title Company |
|---|---|---|---|
| Not Resolvable | $475,000 | -- | |
| Not Resolvable | $421,000 | -- | |
| Deed | $235,000 | -- |
Source: Public Records
Mortgage History
| Date | Status | Loan Amount | Loan Type |
|---|---|---|---|
| Open | $354,000 | Stand Alone Refi Refinance Of Original Loan | |
| Closed | $356,250 | New Conventional | |
| Previous Owner | $408,370 | New Conventional | |
| Previous Owner | $192,000 | No Value Available | |
| Previous Owner | $188,000 | Purchase Money Mortgage |
Source: Public Records
Property History
| Date | Event | Price | Change | Sq Ft Price |
|---|---|---|---|---|
| 06/25/2025 06/25/25 | For Sale | $525,000 | 0.0% | $979 / Sq Ft |
| 12/21/2024 12/21/24 | Off Market | $3,150 | -- | -- |
| 11/18/2024 11/18/24 | For Rent | $3,150 | 0.0% | -- |
| 10/31/2024 10/31/24 | Off Market | $3,150 | -- | -- |
| 09/27/2024 09/27/24 | For Rent | $3,150 | +5.0% | -- |
| 09/07/2022 09/07/22 | Rented | $3,000 | 0.0% | -- |
| 06/21/2022 06/21/22 | Under Contract | -- | -- | -- |
| 05/23/2022 05/23/22 | For Rent | $3,000 | +21.2% | -- |
| 07/02/2021 07/02/21 | Rented | $2,475 | 0.0% | -- |
| 06/10/2021 06/10/21 | Under Contract | -- | -- | -- |
| 06/01/2021 06/01/21 | Price Changed | $2,475 | -2.9% | $4 / Sq Ft |
| 04/20/2021 04/20/21 | For Rent | $2,550 | +2.0% | -- |
| 09/02/2020 09/02/20 | Rented | $2,500 | +2.0% | -- |
| 06/22/2020 06/22/20 | Under Contract | -- | -- | -- |
| 06/18/2020 06/18/20 | For Rent | $2,450 | +2.1% | -- |
| 12/16/2019 12/16/19 | Rented | $2,400 | -3.0% | -- |
| 12/02/2019 12/02/19 | Under Contract | -- | -- | -- |
| 11/10/2019 11/10/19 | Price Changed | $2,475 | -4.8% | $4 / Sq Ft |
| 10/18/2019 10/18/19 | For Rent | $2,600 | 0.0% | -- |
| 09/01/2019 09/01/19 | Rented | $2,600 | 0.0% | -- |
| 06/21/2019 06/21/19 | Sold | $475,000 | 0.0% | $886 / Sq Ft |
| 06/10/2019 06/10/19 | Under Contract | -- | -- | -- |
| 06/04/2019 06/04/19 | For Rent | $2,600 | 0.0% | -- |
| 05/03/2019 05/03/19 | Pending | -- | -- | -- |
| 04/21/2019 04/21/19 | For Sale | $489,900 | -- | $914 / Sq Ft |
Source: MLS Property Information Network (MLS PIN)
Tax History Compared to Growth
Tax History
| Year | Tax Paid | Tax Assessment Tax Assessment Total Assessment is a certain percentage of the fair market value that is determined by local assessors to be the total taxable value of land and additions on the property. | Land | Improvement |
|---|---|---|---|---|
| 2025 | $5,469 | $472,300 | $0 | $472,300 |
| 2024 | $5,309 | $487,100 | $0 | $487,100 |
| 2023 | $5,125 | $477,200 | $0 | $477,200 |
| 2022 | $4,991 | $458,700 | $0 | $458,700 |
| 2021 | $4,798 | $449,700 | $0 | $449,700 |
| 2020 | $4,021 | $380,800 | $0 | $380,800 |
| 2019 | $3,752 | $356,000 | $0 | $356,000 |
| 2018 | $3,553 | $339,000 | $0 | $339,000 |
| 2017 | $3,356 | $316,900 | $0 | $316,900 |
| 2016 | $3,288 | $298,900 | $0 | $298,900 |
| 2015 | $3,183 | $262,800 | $0 | $262,800 |
| 2014 | $2,951 | $234,600 | $0 | $234,600 |
Source: Public Records
Agents Affiliated with this Home
-
A
Seller Co-Listing Agent in 2025
Amerin McCall
Compass
-
617 Living
Seller's Agent in 2022
617 Living
Compass
(617) 500-9900
11 in this area
74 Total Sales
-
Nicole Blanchard
Seller Co-Listing Agent in 2020
Nicole Blanchard
Compass
(339) 226-0545
2 in this area
17 Total Sales
-
S
Buyer's Agent in 2020
Susan Kieley
Seaport Realty Group
-
Seller's Agent in 2019
Sara Hazel
Keller Williams Coastal Realty
Map
Source: MLS Property Information Network (MLS PIN)
MLS Number: 72485236
APN: SBOS-000000-000006-003065-000002
Disclaimer: Certain information contained herein is derived from information provided by parties other than Homes.com. All information provided is deemed reliable, but is not guaranteed to be accurate and should be independently verified.
![]() The property listing data and information, or the Images, set forth herein were provided to MLS Property Information Network, Inc. from third party sources, including sellers, lessors and public records, and were compiled by MLS Property Information Network, Inc. The property listing data and information, and the Images, are for the personal, non-commercial use of consumers having a good faith interest in purchasing or leasing listed properties of the type displayed to them and may not be used for any purpose other than to identify prospective properties which such consumers may have a good faith interest in purchasing or leasing. MLS Property Information Network, Inc. and its subscribers disclaim any and all representations and warranties as to the accuracy of the property listing data and information, or as to the accuracy of any of the Images, set forth herein.
The property listing data and information, or the Images, set forth herein were provided to MLS Property Information Network, Inc. from third party sources, including sellers, lessors and public records, and were compiled by MLS Property Information Network, Inc. The property listing data and information, and the Images, are for the personal, non-commercial use of consumers having a good faith interest in purchasing or leasing listed properties of the type displayed to them and may not be used for any purpose other than to identify prospective properties which such consumers may have a good faith interest in purchasing or leasing. MLS Property Information Network, Inc. and its subscribers disclaim any and all representations and warranties as to the accuracy of the property listing data and information, or as to the accuracy of any of the Images, set forth herein.
Nearby Homes
- 411 E 3rd St Unit 2
- 515 E 2nd St Unit 204
- 515 E 2nd St Unit 206
- 39 Dorchester St Unit 9
- 428-432 E 3rd St
- 538 E Broadway
- 531-533 E 2nd St Unit 202
- 403 W 1st St Unit 201
- 388 Athens St Unit 1
- 388 Athens St Unit PH
- 388 Athens St
- 405 W First St Unit 1-01
- 405 W First St Unit 303
- 312-320 W 3rd St Unit 205
- 312-320 W 3rd St Unit 204
- 505 E Broadway Unit 2
- 377 W 1st St Unit 9
- 559 E Broadway Unit 559
- 561 E Broadway Unit 561
- 563 E Broadway Unit 563