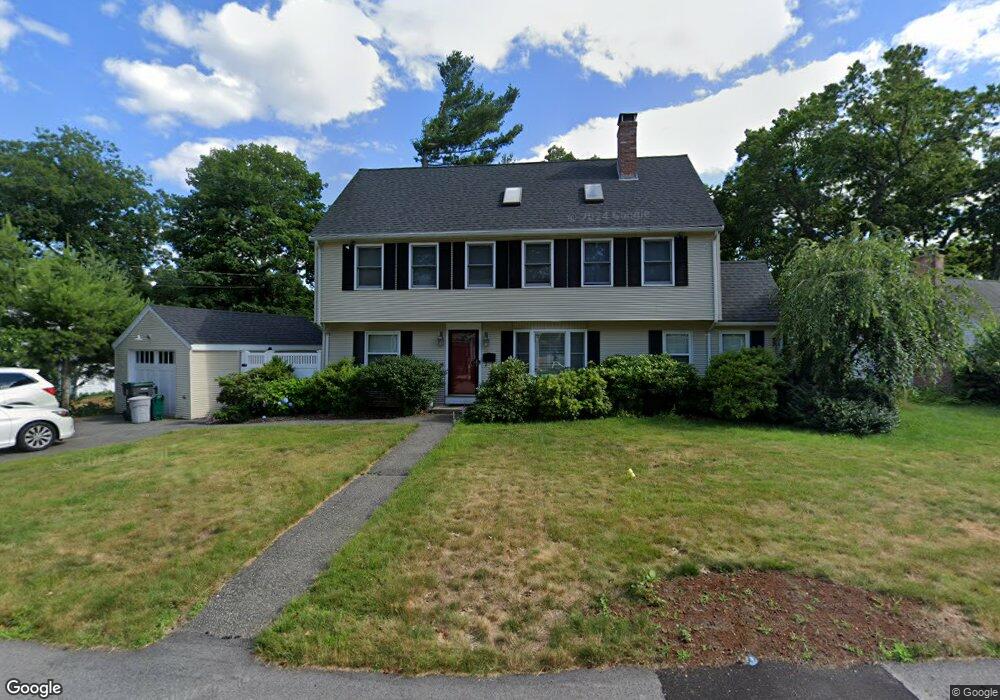
16 Euclid Ave Natick, MA 01760
Estimated Value: $1,066,939 - $1,347,000
5
Beds
2
Baths
2,200
Sq Ft
$549/Sq Ft
Est. Value
About This Home
This home is located at 16 Euclid Ave, Natick, MA 01760 and is currently estimated at $1,206,735, approximately $548 per square foot. 16 Euclid Ave is a home located in Middlesex County with nearby schools including Natick High School, Wilson Middle School, and Bennett-Hemenway (Ben-Hem) Elementary School.
Ownership History
Date
Name
Owned For
Owner Type
Purchase Details
Closed on
Nov 20, 2008
Sold by
Ross James E and Gilmore Mary Ellen
Bought by
Lee Emmeline C and Lee Richard W C
Current Estimated Value
Home Financials for this Owner
Home Financials are based on the most recent Mortgage that was taken out on this home.
Original Mortgage
$300,000
Outstanding Balance
$194,801
Interest Rate
6.03%
Mortgage Type
Purchase Money Mortgage
Estimated Equity
$1,011,934
Create a Home Valuation Report for This Property
The Home Valuation Report is an in-depth analysis detailing your home's value as well as a comparison with similar homes in the area
Home Values in the Area
Average Home Value in this Area
Purchase History
| Date | Buyer | Sale Price | Title Company |
|---|---|---|---|
| Lee Emmeline C | $550,000 | -- |
Source: Public Records
Mortgage History
| Date | Status | Borrower | Loan Amount |
|---|---|---|---|
| Open | Lee Emmeline C | $300,000 |
Source: Public Records
Tax History
| Year | Tax Paid | Tax Assessment Tax Assessment Total Assessment is a certain percentage of the fair market value that is determined by local assessors to be the total taxable value of land and additions on the property. | Land | Improvement |
|---|---|---|---|---|
| 2025 | $9,942 | $831,300 | $427,600 | $403,700 |
| 2024 | $9,580 | $781,400 | $402,500 | $378,900 |
| 2023 | $9,615 | $760,700 | $387,100 | $373,600 |
| 2022 | $9,413 | $705,600 | $351,700 | $353,900 |
| 2021 | $9,011 | $662,100 | $331,600 | $330,500 |
| 2020 | $8,807 | $647,100 | $316,600 | $330,500 |
| 2019 | $7,560 | $647,100 | $316,600 | $330,500 |
| 2018 | $8,117 | $622,000 | $301,500 | $320,500 |
| 2017 | $7,708 | $571,400 | $256,900 | $314,500 |
| 2016 | $7,431 | $547,600 | $235,900 | $311,700 |
| 2015 | $7,163 | $518,300 | $235,900 | $282,400 |
Source: Public Records
Map
Nearby Homes
Your Personal Tour Guide
Ask me questions while you tour the home.