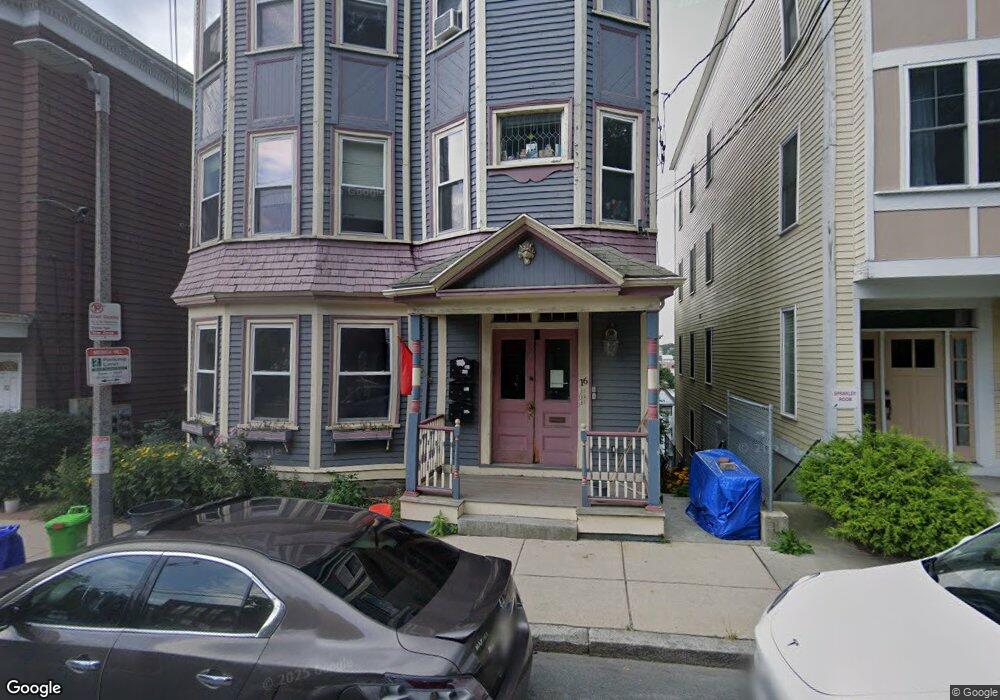
16 Fisher Ave Unit 3 Roxbury Crossing, MA 02120
Mission Hill NeighborhoodEstimated Value: $1,952,000 - $2,406,000
4
Beds
3
Baths
1,200
Sq Ft
$1,871/Sq Ft
Est. Value
About This Home
This home is located at 16 Fisher Ave Unit 3, Roxbury Crossing, MA 02120 and is currently estimated at $2,245,333, approximately $1,871 per square foot. 16 Fisher Ave Unit 3 is a home located in Suffolk County with nearby schools including Roxbury Preparatory Charter School, Malik Academy, and Manville School.
Ownership History
Date
Name
Owned For
Owner Type
Purchase Details
Closed on
Mar 26, 2014
Sold by
Fecteau Herculano T
Bought by
H Fecteau Ret
Current Estimated Value
Purchase Details
Closed on
Jun 7, 2000
Sold by
Keller Richard T
Bought by
Fecteau Herculano T
Create a Home Valuation Report for This Property
The Home Valuation Report is an in-depth analysis detailing your home's value as well as a comparison with similar homes in the area
Home Values in the Area
Average Home Value in this Area
Purchase History
| Date | Buyer | Sale Price | Title Company |
|---|---|---|---|
| H Fecteau Ret | -- | -- | |
| Fecteau Herculano T | $22,500 | -- |
Source: Public Records
Mortgage History
| Date | Status | Borrower | Loan Amount |
|---|---|---|---|
| Previous Owner | Fecteau Herculano T | $310,000 | |
| Previous Owner | Fecteau Herculano T | $140,000 | |
| Previous Owner | Fecteau Herculano T | $92,500 |
Source: Public Records
Tax History Compared to Growth
Tax History
| Year | Tax Paid | Tax Assessment Tax Assessment Total Assessment is a certain percentage of the fair market value that is determined by local assessors to be the total taxable value of land and additions on the property. | Land | Improvement |
|---|---|---|---|---|
| 2025 | $20,919 | $1,806,500 | $639,400 | $1,167,100 |
| 2024 | $17,876 | $1,640,000 | $299,000 | $1,341,000 |
| 2023 | $17,100 | $1,592,200 | $290,300 | $1,301,900 |
| 2022 | $16,040 | $1,474,300 | $268,800 | $1,205,500 |
| 2021 | $14,982 | $1,404,100 | $256,000 | $1,148,100 |
| 2020 | $14,453 | $1,368,700 | $244,900 | $1,123,800 |
| 2019 | $13,117 | $1,244,500 | $172,000 | $1,072,500 |
| 2018 | $12,075 | $1,152,200 | $172,000 | $980,200 |
| 2017 | $10,610 | $1,001,900 | $172,000 | $829,900 |
| 2016 | $10,300 | $936,400 | $172,000 | $764,400 |
| 2015 | $9,744 | $804,600 | $230,800 | $573,800 |
| 2014 | $8,766 | $696,800 | $230,800 | $466,000 |
Source: Public Records
Map
Nearby Homes
- 22 Fisher Ave
- 59 Fort Ave
- 743 Parker St Unit 3
- 97 Hillside St
- 130 Minden St
- 91-93 Calumet St
- 11 Gay Head St
- 7 Oswald St
- 92 Lawn St Unit 7-160
- 4 Fort Ave Unit 2
- 100 Lawn St Unit 100
- 63 Beech Glen St
- 10 Linwood St
- 143 Hillside St
- 249 Roxbury St Unit 1
- 70 Day St Unit 2
- 70 Day St
- 70 Day St Unit 1
- 3 Kenney St Unit 2
- 31 Dorr St
- 16 Fisher Ave
- 16 Fisher Ave Unit 2
- 16 Fisher Ave Unit 4
- 16 Fisher Ave
- 20 Fisher Ave Unit 1
- 20 Fisher Ave Unit 3
- 20 Fisher Ave Unit 28-1
- 20 Fisher Ave Unit 28-2
- 20 Fisher Ave Unit 22
- 20 Fisher Ave Unit 22-1
- 20 Fisher Ave
- 20 Fisher Ave
- 20 Fisher Ave Unit 2
- 12 Fisher Ave Unit 6
- 12 Fisher Ave Unit 5
- 12 Fisher Ave Unit 4
- 12 Fisher Ave Unit 3
- 12 Fisher Ave Unit 2
- 12 Fisher Ave Unit 1
- 12 Fisher Ave