16 Glen Ln Randolph, MA 02368
North Randolph NeighborhoodEstimated Value: $542,000 - $608,387
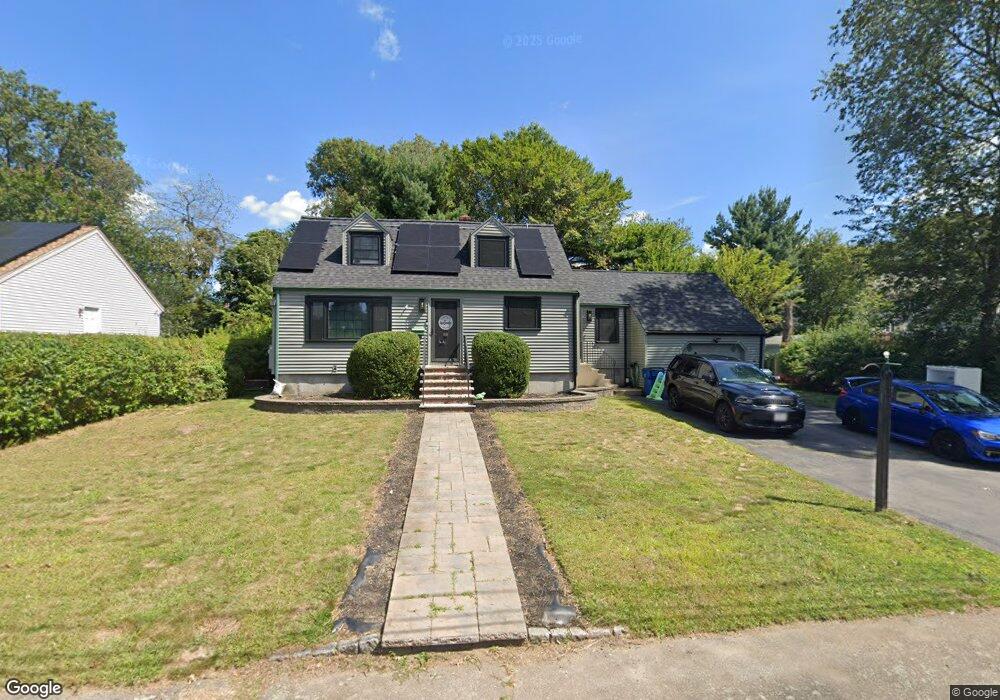
About This Home
This home is located at 16 Glen Ln, Randolph, MA 02368 and is currently estimated at $568,847, approximately $359 per square foot. 16 Glen Ln is a home located in Norfolk County with nearby schools including Randolph High School.
Ownership History
We collect this data history from publicly available records. To have your information removed, we recommend requesting removal directly through your county’s website.
Purchase Details
Home Financials for this Owner
Home Financials are based on the most recent Mortgage that was taken out on this home.Purchase Details
Home Values in the Area
Average Home Value in this Area
Purchase History
We collect this data history from publicly available records. To have your information removed, we recommend requesting removal directly through your county’s website.
| Date | Buyer | Sale Price | Title Company |
|---|---|---|---|
| $350,000 | None Available | ||
| -- | -- |
Mortgage History
We collect this data history from publicly available records. To have your information removed, we recommend requesting removal directly through your county’s website.
| Date | Status | Borrower | Loan Amount |
|---|---|---|---|
| Open | $263,000 |
Tax History
We collect this data history from publicly available records. To have your information removed, we recommend requesting removal directly through your county’s website.
| Year | Tax Paid | Tax Assessment Tax Assessment Total Assessment is a certain percentage of the fair market value that is determined by local assessors to be the total taxable value of land and additions on the property. | Land | Improvement |
|---|---|---|---|---|
| 2025 | $6,118 | $527,000 | $251,600 | $275,400 |
| 2024 | $5,920 | $517,000 | $246,700 | $270,300 |
| 2023 | $5,696 | $471,500 | $224,300 | $247,200 |
| 2022 | $5,712 | $420,000 | $186,900 | $233,100 |
| 2021 | $5,514 | $373,100 | $155,800 | $217,300 |
| 2020 | $5,383 | $361,000 | $155,800 | $205,200 |
| 2019 | $5,113 | $341,300 | $148,300 | $193,000 |
| 2018 | $4,929 | $310,400 | $134,800 | $175,600 |
| 2017 | $4,856 | $300,100 | $128,400 | $171,700 |
| 2016 | $4,659 | $267,900 | $116,700 | $151,200 |
| 2015 | $4,427 | $244,600 | $111,100 | $133,500 |
Map
- 304 High St
- 232 Canton St Unit 308
- 232 Canton St Unit 107
- 232 Canton St Unit 112
- 232 Canton St Unit 104
- 232 Canton St Unit 206
- 9 Denise Dr
- 4 Haddad Ave
- 1707 Irving Rd
- 1603 Irving Rd
- 67 Emeline St
- 21 Pauline St
- 6 Sunset Dr
- 1 Royal Crest Dr Unit 3
- 12 Althea Rd
- 15 Sunset Dr
- 7 Waldo St
- 13 Wordsworth St
- 32 Hills St
- 32 Crawford St
- 10 Glen Ln
- 12 Glen Ln
- 9 Glen Ln
- 7 Glen Ln
- 5 Glen Ln
- 14 Glen Ln
- 140 Canton St Unit F3
- 140 Canton St Unit I6
- 140 Canton St Unit D6
- 140 Canton St Unit E4
- 140 Canton St Unit I3
- 140 Canton St Unit B
- 1 Franklin Square-C Unit C-1
- 1 Franklin Square--E Unit E-1
- 1 Franklin Square-B Unit B1
- 15 Glen Ln
- 3 Glen Ln
- 3 Franklin Square Unit B
- 1 Franklin Square Unit 1-I
- 1 Franklin Square Unit H
Ask me questions while you tour the home.