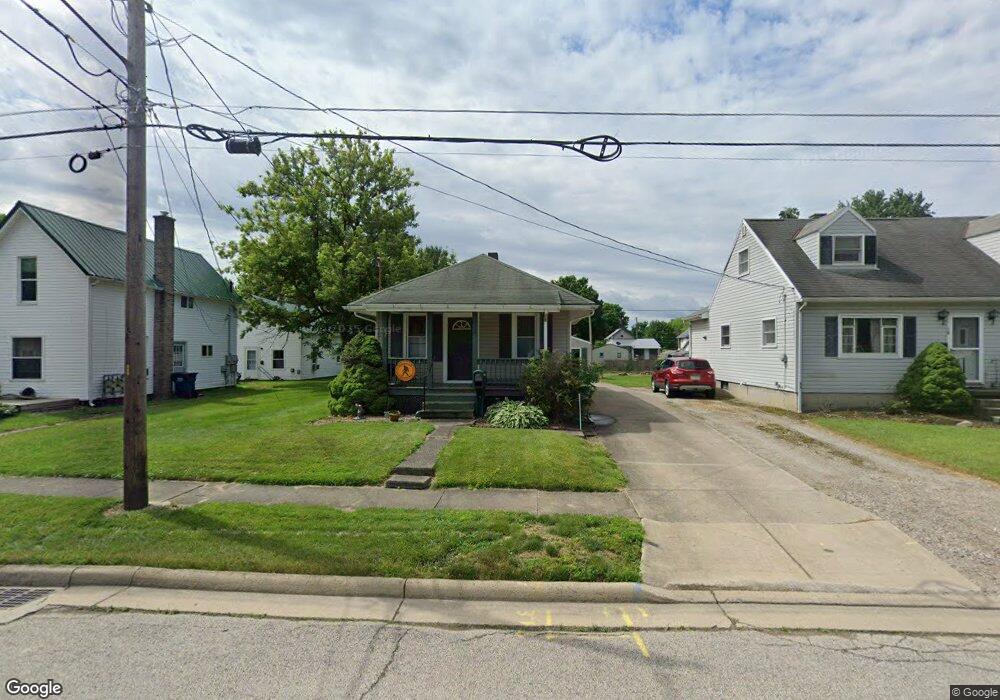
16 Grove Ave Shelby, OH 44875
Estimated Value: $113,104 - $133,000
3
Beds
1
Bath
800
Sq Ft
$154/Sq Ft
Est. Value
About This Home
This home is located at 16 Grove Ave, Shelby, OH 44875 and is currently estimated at $123,026, approximately $153 per square foot. 16 Grove Ave is a home located in Richland County with nearby schools including St. Mary's School.
Ownership History
Date
Name
Owned For
Owner Type
Purchase Details
Closed on
Jul 10, 1998
Sold by
Sexton Albert A
Bought by
Robertson Kevin B
Current Estimated Value
Home Financials for this Owner
Home Financials are based on the most recent Mortgage that was taken out on this home.
Original Mortgage
$50,850
Outstanding Balance
$10,560
Interest Rate
7.17%
Mortgage Type
New Conventional
Estimated Equity
$112,466
Purchase Details
Closed on
Jun 13, 1995
Sold by
Yetzer Gary A
Bought by
Sexton Albert A and Sexton Lula
Purchase Details
Closed on
Jun 17, 1991
Bought by
Krebs Carol M
Purchase Details
Closed on
Jul 1, 1985
Create a Home Valuation Report for This Property
The Home Valuation Report is an in-depth analysis detailing your home's value as well as a comparison with similar homes in the area
Home Values in the Area
Average Home Value in this Area
Purchase History
| Date | Buyer | Sale Price | Title Company |
|---|---|---|---|
| Robertson Kevin B | $56,500 | -- | |
| Sexton Albert A | $43,000 | -- | |
| Krebs Carol M | $22,000 | -- | |
| -- | $30,000 | -- |
Source: Public Records
Mortgage History
| Date | Status | Borrower | Loan Amount |
|---|---|---|---|
| Open | Robertson Kevin B | $50,850 |
Source: Public Records
Tax History Compared to Growth
Tax History
| Year | Tax Paid | Tax Assessment Tax Assessment Total Assessment is a certain percentage of the fair market value that is determined by local assessors to be the total taxable value of land and additions on the property. | Land | Improvement |
|---|---|---|---|---|
| 2024 | $972 | $25,430 | $4,220 | $21,210 |
| 2023 | $972 | $25,430 | $4,220 | $21,210 |
| 2022 | $981 | $22,960 | $4,280 | $18,680 |
| 2021 | $981 | $22,960 | $4,280 | $18,680 |
| 2020 | $982 | $22,960 | $4,280 | $18,680 |
| 2019 | $914 | $19,610 | $3,630 | $15,980 |
| 2018 | $905 | $19,610 | $3,630 | $15,980 |
| 2017 | $925 | $19,610 | $3,630 | $15,980 |
| 2016 | $953 | $20,980 | $3,440 | $17,540 |
| 2015 | $948 | $20,980 | $3,440 | $17,540 |
| 2014 | $916 | $20,980 | $3,440 | $17,540 |
| 2012 | $451 | $20,990 | $3,630 | $17,360 |
Source: Public Records
Map
Nearby Homes