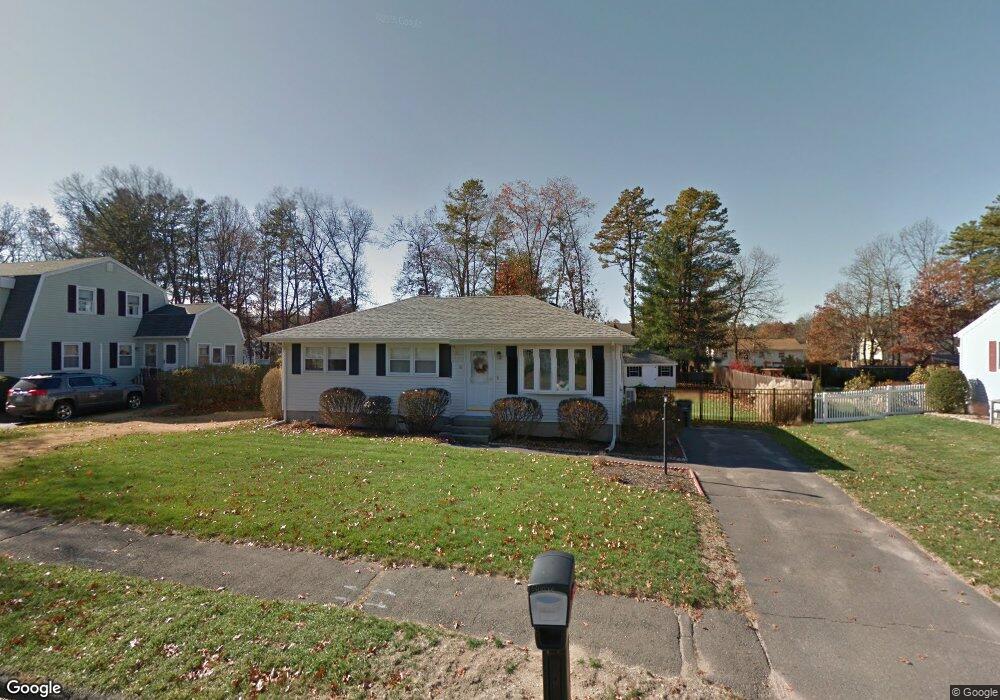
16 Gula Dr Easthampton, MA 01027
Estimated Value: $324,000 - $359,000
3
Beds
2
Baths
960
Sq Ft
$358/Sq Ft
Est. Value
About This Home
This home is located at 16 Gula Dr, Easthampton, MA 01027 and is currently estimated at $343,504, approximately $357 per square foot. 16 Gula Dr is a home located in Hampshire County with nearby schools including Easthampton High School, Calvary Baptist Christian School, and Tri-County Schools.
Ownership History
Date
Name
Owned For
Owner Type
Purchase Details
Closed on
Jul 26, 1994
Sold by
Dempsey Dianne M and Dempsey Matthew S
Bought by
Brouillete Leo R and Brouillete Beverly L
Current Estimated Value
Home Financials for this Owner
Home Financials are based on the most recent Mortgage that was taken out on this home.
Original Mortgage
$97,850
Interest Rate
8.19%
Mortgage Type
Purchase Money Mortgage
Create a Home Valuation Report for This Property
The Home Valuation Report is an in-depth analysis detailing your home's value as well as a comparison with similar homes in the area
Home Values in the Area
Average Home Value in this Area
Purchase History
| Date | Buyer | Sale Price | Title Company |
|---|---|---|---|
| Brouillete Leo R | $103,000 | -- |
Source: Public Records
Mortgage History
| Date | Status | Borrower | Loan Amount |
|---|---|---|---|
| Closed | Brouillete Leo R | $67,000 | |
| Closed | Brouillete Leo R | $15,988 | |
| Closed | Brouillete Leo R | $10,586 | |
| Closed | Brouillete Leo R | $97,850 |
Source: Public Records
Tax History
| Year | Tax Paid | Tax Assessment Tax Assessment Total Assessment is a certain percentage of the fair market value that is determined by local assessors to be the total taxable value of land and additions on the property. | Land | Improvement |
|---|---|---|---|---|
| 2025 | $4,392 | $321,300 | $118,300 | $203,000 |
| 2024 | $4,239 | $312,600 | $114,900 | $197,700 |
| 2023 | $3,217 | $219,600 | $90,400 | $129,200 |
| 2022 | $3,630 | $219,600 | $90,400 | $129,200 |
| 2021 | $3,968 | $226,200 | $90,400 | $135,800 |
| 2020 | $3,900 | $219,600 | $90,400 | $129,200 |
| 2019 | $2,992 | $193,500 | $90,400 | $103,100 |
| 2018 | $2,874 | $179,600 | $85,400 | $94,200 |
| 2017 | $2,803 | $172,900 | $82,100 | $90,800 |
| 2016 | $2,884 | $185,000 | $82,100 | $102,900 |
| 2015 | $2,803 | $185,000 | $82,100 | $102,900 |
Source: Public Records
Map
Nearby Homes
Your Personal Tour Guide
Ask me questions while you tour the home.