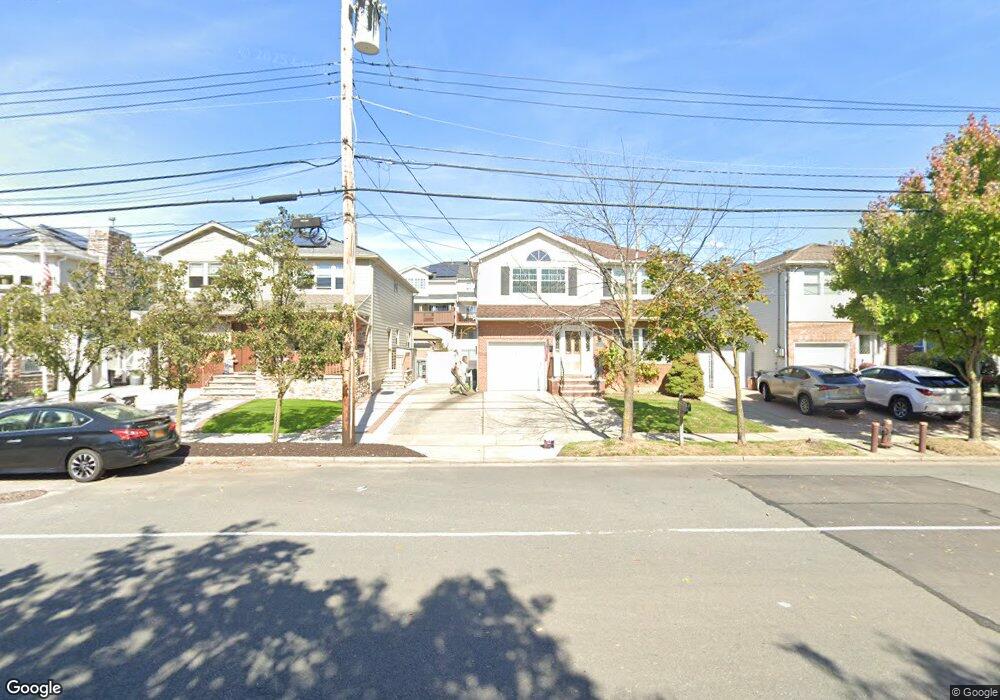
16 Hemlock Ln Staten Island, NY 10309
Woodrow NeighborhoodEstimated Value: $865,000 - $920,000
4
Beds
3
Baths
2,700
Sq Ft
$328/Sq Ft
Est. Value
About This Home
This home is located at 16 Hemlock Ln, Staten Island, NY 10309 and is currently estimated at $885,940, approximately $328 per square foot. 16 Hemlock Ln is a home located in Richmond County with nearby schools including Kathleen Grimm School For Leadership, P.S. 6 Cpl Allan F Kivlehan School, and Is 34 Tottenville.
Ownership History
Date
Name
Owned For
Owner Type
Purchase Details
Closed on
Jul 13, 2007
Sold by
Bulone Ignazio and Bulone Susan
Bought by
Warshawsky Clifford and Khramova Yuliya
Current Estimated Value
Home Financials for this Owner
Home Financials are based on the most recent Mortgage that was taken out on this home.
Original Mortgage
$416,800
Outstanding Balance
$261,058
Interest Rate
6.54%
Mortgage Type
Purchase Money Mortgage
Estimated Equity
$624,882
Purchase Details
Closed on
Jun 12, 2000
Sold by
Dimino Lisa M
Bought by
Bulone Ignazio and Bulone Susan
Home Financials for this Owner
Home Financials are based on the most recent Mortgage that was taken out on this home.
Original Mortgage
$233,600
Interest Rate
8.48%
Purchase Details
Closed on
Aug 28, 1996
Sold by
Sharrotts Woods Inc
Bought by
Dimino Lisa M
Create a Home Valuation Report for This Property
The Home Valuation Report is an in-depth analysis detailing your home's value as well as a comparison with similar homes in the area
Home Values in the Area
Average Home Value in this Area
Purchase History
| Date | Buyer | Sale Price | Title Company |
|---|---|---|---|
| Warshawsky Clifford | $521,000 | None Available | |
| Bulone Ignazio | $292,000 | -- | |
| Dimino Lisa M | $238,000 | Commonwealth Land Title Ins |
Source: Public Records
Mortgage History
| Date | Status | Borrower | Loan Amount |
|---|---|---|---|
| Open | Warshawsky Clifford | $416,800 | |
| Previous Owner | Bulone Ignazio | $233,600 |
Source: Public Records
Tax History Compared to Growth
Tax History
| Year | Tax Paid | Tax Assessment Tax Assessment Total Assessment is a certain percentage of the fair market value that is determined by local assessors to be the total taxable value of land and additions on the property. | Land | Improvement |
|---|---|---|---|---|
| 2025 | $7,518 | $53,040 | $6,891 | $46,149 |
| 2024 | $7,530 | $43,320 | $7,960 | $35,360 |
| 2023 | $7,156 | $36,634 | $7,005 | $29,629 |
| 2022 | $6,612 | $40,260 | $8,880 | $31,380 |
| 2021 | $6,970 | $34,980 | $8,880 | $26,100 |
| 2020 | $6,965 | $37,260 | $8,880 | $28,380 |
| 2019 | $6,476 | $33,360 | $8,880 | $24,480 |
| 2018 | $5,925 | $30,528 | $8,622 | $21,906 |
| 2017 | $5,571 | $28,800 | $8,880 | $19,920 |
| 2016 | $5,699 | $30,060 | $8,880 | $21,180 |
| 2015 | $6,034 | $33,060 | $8,220 | $24,840 |
| 2014 | $6,034 | $33,033 | $8,213 | $24,820 |
Source: Public Records
Map
Nearby Homes
- 14 Hemlock Ln
- 18 Hemlock Ln
- 24 Hemlock Ln
- 17 White Oak Ln
- 17 Hemlock Ln
- 15 Hemlock Ln
- 26 Hemlock Ln
- 15 White Oak Ln
- 23 Hemlock St
- 21 Hemlock Ln
- 99 Sharrotts Rd
- 25 White Oak Ln
- 103 Sharrotts Rd
- 23 Hemlock Ln
- 95 Sharrotts Rd
- 107 Sharrotts Rd
- 27 White Oak Ln
- 30 Hemlock Ln
- 91 Sharrotts Rd
- 29 White Oak Ln