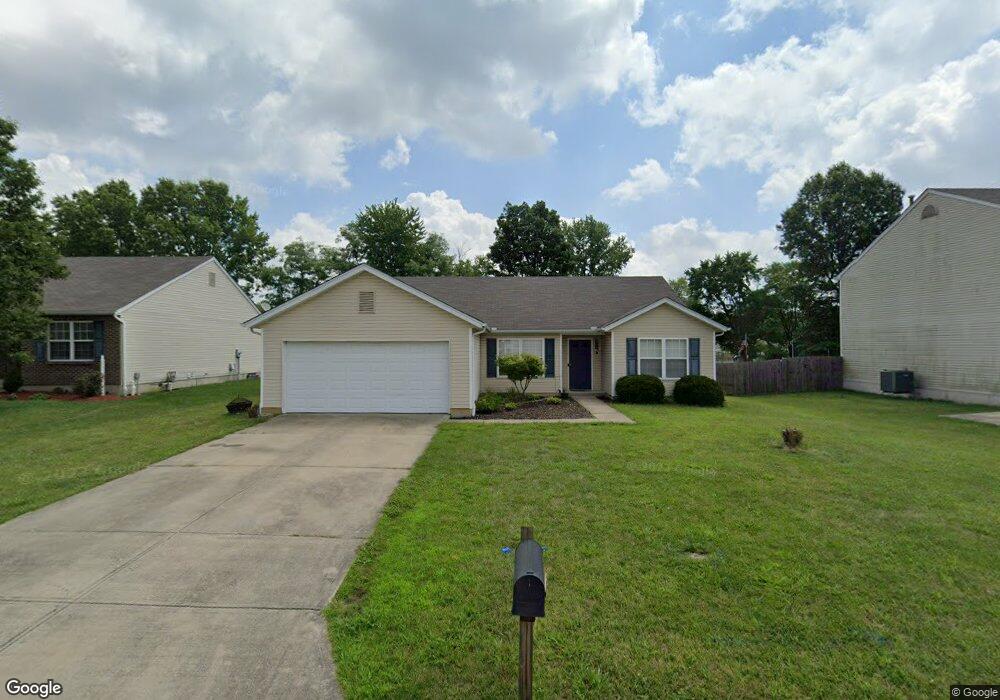
16 Hummingbird Way Amelia, OH 45102
Estimated Value: $268,000 - $296,000
3
Beds
2
Baths
1,551
Sq Ft
$184/Sq Ft
Est. Value
About This Home
This home is located at 16 Hummingbird Way, Amelia, OH 45102 and is currently estimated at $285,598, approximately $184 per square foot. 16 Hummingbird Way is a home located in Clermont County with nearby schools including Amelia Elementary School, West Clermont Middle School, and West Clermont High School.
Ownership History
Date
Name
Owned For
Owner Type
Purchase Details
Closed on
Dec 7, 2016
Sold by
Stanton Dustin M and Stanton Ashley M
Bought by
Stanton Dustin M and Stanton Ashley M
Current Estimated Value
Purchase Details
Closed on
Sep 21, 2011
Sold by
Price Jay
Bought by
Stanton Dustin
Home Financials for this Owner
Home Financials are based on the most recent Mortgage that was taken out on this home.
Original Mortgage
$97,465
Outstanding Balance
$66,712
Interest Rate
4.25%
Mortgage Type
FHA
Estimated Equity
$218,886
Purchase Details
Closed on
Nov 15, 2004
Sold by
Crossman Communities Of Ohio Inc
Bought by
Price Jay
Home Financials for this Owner
Home Financials are based on the most recent Mortgage that was taken out on this home.
Original Mortgage
$115,692
Interest Rate
3.75%
Mortgage Type
Unknown
Create a Home Valuation Report for This Property
The Home Valuation Report is an in-depth analysis detailing your home's value as well as a comparison with similar homes in the area
Home Values in the Area
Average Home Value in this Area
Purchase History
| Date | Buyer | Sale Price | Title Company |
|---|---|---|---|
| Stanton Dustin M | $125 | First American Title | |
| Stanton Dustin | $100,000 | Stonebridge Land Title Agenc | |
| Price Jay | $144,700 | -- |
Source: Public Records
Mortgage History
| Date | Status | Borrower | Loan Amount |
|---|---|---|---|
| Open | Stanton Dustin | $97,465 | |
| Previous Owner | Price Jay | $115,692 |
Source: Public Records
Tax History Compared to Growth
Tax History
| Year | Tax Paid | Tax Assessment Tax Assessment Total Assessment is a certain percentage of the fair market value that is determined by local assessors to be the total taxable value of land and additions on the property. | Land | Improvement |
|---|---|---|---|---|
| 2024 | $4,106 | $80,400 | $14,910 | $65,490 |
| 2023 | $4,112 | $80,400 | $14,910 | $65,490 |
| 2022 | $3,332 | $56,630 | $10,500 | $46,130 |
| 2021 | $3,294 | $56,630 | $10,500 | $46,130 |
| 2020 | $3,295 | $56,630 | $10,500 | $46,130 |
| 2019 | $2,197 | $41,300 | $10,290 | $31,010 |
| 2018 | $2,219 | $41,300 | $10,290 | $31,010 |
| 2017 | $2,252 | $41,300 | $10,290 | $31,010 |
| 2016 | $2,174 | $36,540 | $9,100 | $27,440 |
| 2015 | $2,033 | $36,540 | $9,100 | $27,440 |
| 2014 | $2,030 | $36,540 | $9,100 | $27,440 |
| 2013 | $2,099 | $37,420 | $10,500 | $26,920 |
Source: Public Records
Map
Nearby Homes
- 3330 Huntsman Trace Unit 803C
- 247 Deer Creek Dr
- 59 Red Bud Cir
- 19 Bobwhite Ct
- 9 Woodsong Ct
- 45 Platform St
- 23 Belwood Ct
- 21 Mallard Dr
- 25 Locustwood Ct
- 46 Spicewood Dr
- 2167 Ohio 125
- 2139 Ohio 125
- 1969 Ohio 125
- 1577 Ulrey Cir
- 105 Cedarwood Dr
- 3478 Hickory Ln
- 1466 Locust Lake Rd
- 1438 Locust Lake Rd
- 1408 Dale Rd
- 52 Charmalee Dr
- 18 Hummingbird Way
- 14 Hummingbird Way
- 20 Hummingbird Way
- 39 Quail Brace Ct
- 13 Hummingbird Way
- 37 Quail Brace Ct
- 15 Hummingbird Way
- 11 Hummingbird Way
- 41 Quail Brace Ct
- 22 Hummingbird Way
- 10 Hummingbird Way
- 17 Hummingbird Way
- 38 Hunters Ct
- 9 Hummingbird Way
- 36 Hunters Ct
- 19 Hummingbird Way
- 34 Hunters Ct Unit 809C
- 35 Quail Brace Ct
- 32 Hunters Ct Unit 809D
- 43 Quail Brace Ct