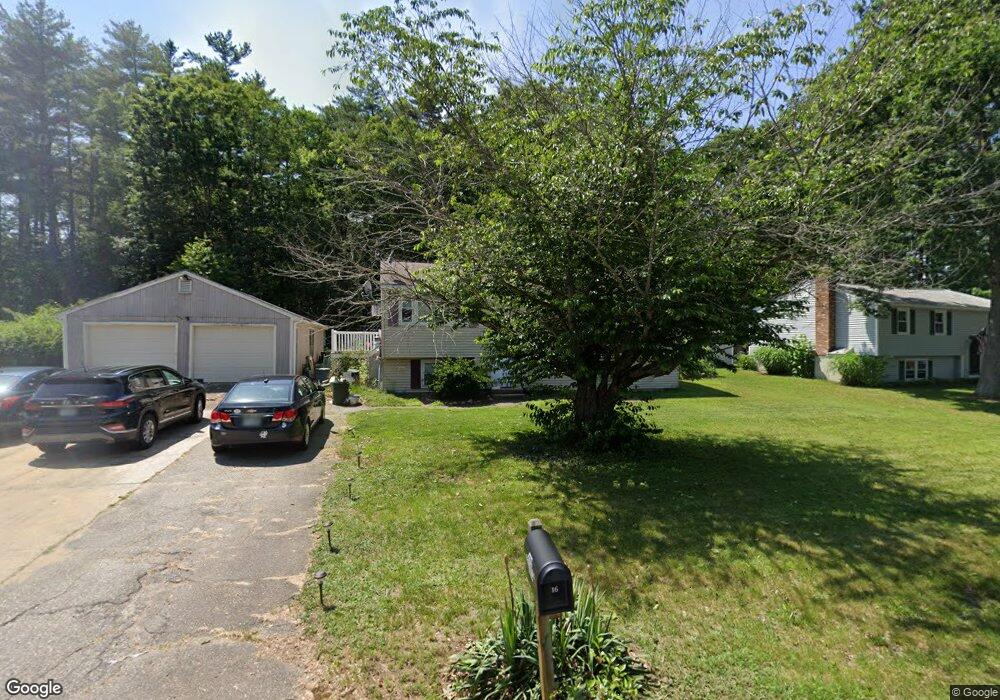
16 Iris Dr MerriMacK, NH 03054
Estimated Value: $485,000 - $556,000
3
Beds
2
Baths
1,815
Sq Ft
$294/Sq Ft
Est. Value
About This Home
This home is located at 16 Iris Dr, MerriMacK, NH 03054 and is currently estimated at $534,157, approximately $294 per square foot. 16 Iris Dr is a home located in Hillsborough County with nearby schools including Thorntons Ferry School, Merrimack Middle School, and James Mastricola Upper Elementary School.
Ownership History
Date
Name
Owned For
Owner Type
Purchase Details
Closed on
Jun 22, 2020
Sold by
Rossetti Gail
Bought by
Rossetti Steven J and Rossetti Marisa
Current Estimated Value
Home Financials for this Owner
Home Financials are based on the most recent Mortgage that was taken out on this home.
Original Mortgage
$156,750
Outstanding Balance
$137,712
Interest Rate
3.2%
Mortgage Type
Purchase Money Mortgage
Estimated Equity
$396,445
Purchase Details
Closed on
Jun 28, 2005
Sold by
Dyer Jeffrey R and Dyer Jennifer J
Bought by
Rossetti Gail
Purchase Details
Closed on
Jun 13, 2001
Sold by
Wyatt Ii William C and Wyatt Jane M
Bought by
Dyer Jeffrey R and Dyer Jennifer J
Home Financials for this Owner
Home Financials are based on the most recent Mortgage that was taken out on this home.
Original Mortgage
$141,400
Interest Rate
7.15%
Create a Home Valuation Report for This Property
The Home Valuation Report is an in-depth analysis detailing your home's value as well as a comparison with similar homes in the area
Home Values in the Area
Average Home Value in this Area
Purchase History
| Date | Buyer | Sale Price | Title Company |
|---|---|---|---|
| Rossetti Steven J | $165,000 | None Available | |
| Rossetti Gail | $288,000 | -- | |
| Dyer Jeffrey R | $176,800 | -- |
Source: Public Records
Mortgage History
| Date | Status | Borrower | Loan Amount |
|---|---|---|---|
| Open | Rossetti Steven J | $156,750 | |
| Previous Owner | Dyer Jeffrey R | $141,400 |
Source: Public Records
Tax History
| Year | Tax Paid | Tax Assessment Tax Assessment Total Assessment is a certain percentage of the fair market value that is determined by local assessors to be the total taxable value of land and additions on the property. | Land | Improvement |
|---|---|---|---|---|
| 2025 | $8,225 | $372,000 | $182,700 | $189,300 |
| 2024 | $7,697 | $372,000 | $182,700 | $189,300 |
| 2023 | $7,235 | $372,000 | $182,700 | $189,300 |
| 2022 | $6,465 | $372,000 | $182,700 | $189,300 |
| 2021 | $6,387 | $372,000 | $182,700 | $189,300 |
| 2020 | $6,366 | $264,600 | $125,800 | $138,800 |
| 2019 | $6,385 | $264,600 | $125,800 | $138,800 |
| 2018 | $6,382 | $264,600 | $125,800 | $138,800 |
| 2017 | $6,184 | $264,600 | $125,800 | $138,800 |
| 2016 | $6,030 | $264,600 | $125,800 | $138,800 |
| 2015 | $5,636 | $228,000 | $117,400 | $110,600 |
| 2014 | $5,493 | $228,000 | $117,400 | $110,600 |
| 2013 | $5,528 | $231,200 | $117,400 | $113,800 |
Source: Public Records
Map
Nearby Homes
- 1 Juniper Way
- 23 McQuestion Rd
- 11 Echo Shore Dr
- 3 Independence Dr
- 8 Wilson Hill Rd
- 31 McElwain St
- 11 Wilson Hill Rd
- 23 Valleyview Dr
- 25 Independence Dr
- 11 Winrow Dr
- 51 Joppa Rd
- 12 Fernwood Dr
- 1 Killian Ct
- 10 Killian Ct
- 69 Joppa Rd
- 3 Wallace Dr
- 53 E Ridge Rd Unit 53
- 3 Arlington St
- 55A E Ridge Rd
- 15 Clay St
Your Personal Tour Guide
Ask me questions while you tour the home.