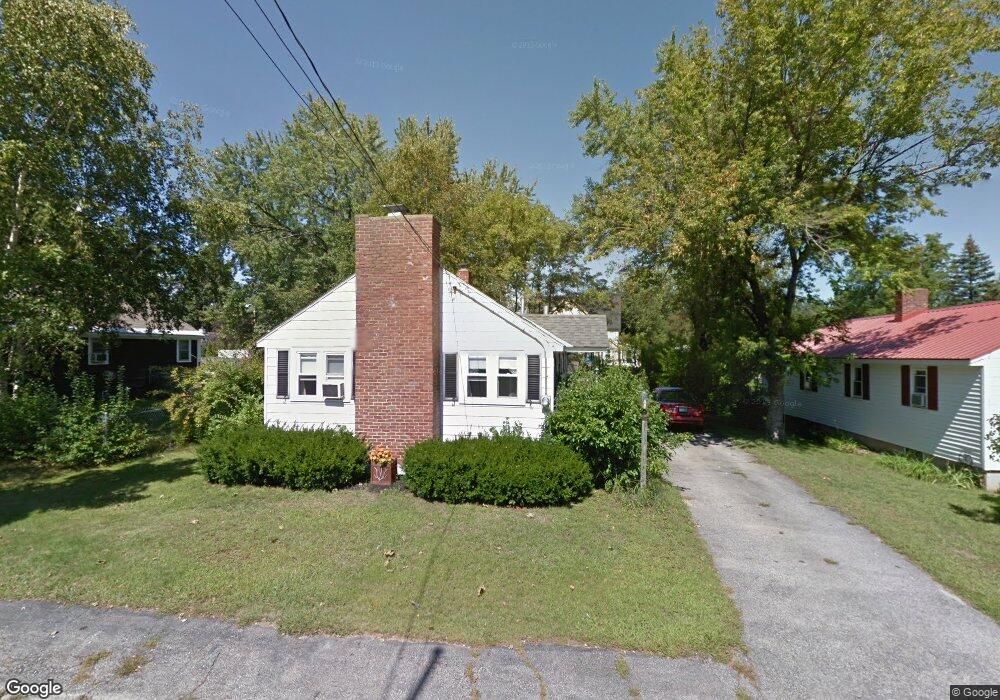
16 Joffre St Concord, NH 03301
South End NeighborhoodEstimated Value: $355,892 - $402,000
2
Beds
1
Bath
792
Sq Ft
$479/Sq Ft
Est. Value
About This Home
This home is located at 16 Joffre St, Concord, NH 03301 and is currently estimated at $379,473, approximately $479 per square foot. 16 Joffre St is a home located in Merrimack County with nearby schools including Abbot-Downing School, Rundlett Middle School, and Concord High School.
Ownership History
Date
Name
Owned For
Owner Type
Purchase Details
Closed on
Nov 4, 1996
Sold by
Warriner John D and Warriner Jacqueline M
Bought by
Devon George J and Devon Michelle I
Current Estimated Value
Home Financials for this Owner
Home Financials are based on the most recent Mortgage that was taken out on this home.
Original Mortgage
$61,300
Interest Rate
8.07%
Mortgage Type
Purchase Money Mortgage
Create a Home Valuation Report for This Property
The Home Valuation Report is an in-depth analysis detailing your home's value as well as a comparison with similar homes in the area
Home Values in the Area
Average Home Value in this Area
Purchase History
| Date | Buyer | Sale Price | Title Company |
|---|---|---|---|
| Devon George J | $76,000 | -- |
Source: Public Records
Mortgage History
| Date | Status | Borrower | Loan Amount |
|---|---|---|---|
| Open | Devon George J | $128,500 | |
| Closed | Devon George J | $114,000 | |
| Closed | Devon George J | $61,300 |
Source: Public Records
Tax History Compared to Growth
Tax History
| Year | Tax Paid | Tax Assessment Tax Assessment Total Assessment is a certain percentage of the fair market value that is determined by local assessors to be the total taxable value of land and additions on the property. | Land | Improvement |
|---|---|---|---|---|
| 2024 | $5,386 | $194,500 | $102,500 | $92,000 |
| 2023 | $5,224 | $194,500 | $102,500 | $92,000 |
| 2022 | $5,036 | $194,500 | $102,500 | $92,000 |
| 2021 | $4,908 | $195,400 | $102,500 | $92,900 |
| 2020 | $4,608 | $172,200 | $85,600 | $86,600 |
| 2019 | $4,395 | $158,200 | $84,200 | $74,000 |
| 2018 | $4,206 | $149,200 | $80,900 | $68,300 |
| 2017 | $4,061 | $143,800 | $79,400 | $64,400 |
| 2016 | $3,843 | $138,900 | $79,400 | $59,500 |
| 2015 | $3,713 | $128,400 | $72,200 | $56,200 |
| 2014 | $3,442 | $128,400 | $72,200 | $56,200 |
| 2013 | -- | $126,400 | $72,200 | $54,200 |
| 2012 | -- | $125,800 | $72,200 | $53,600 |
Source: Public Records
Map
Nearby Homes