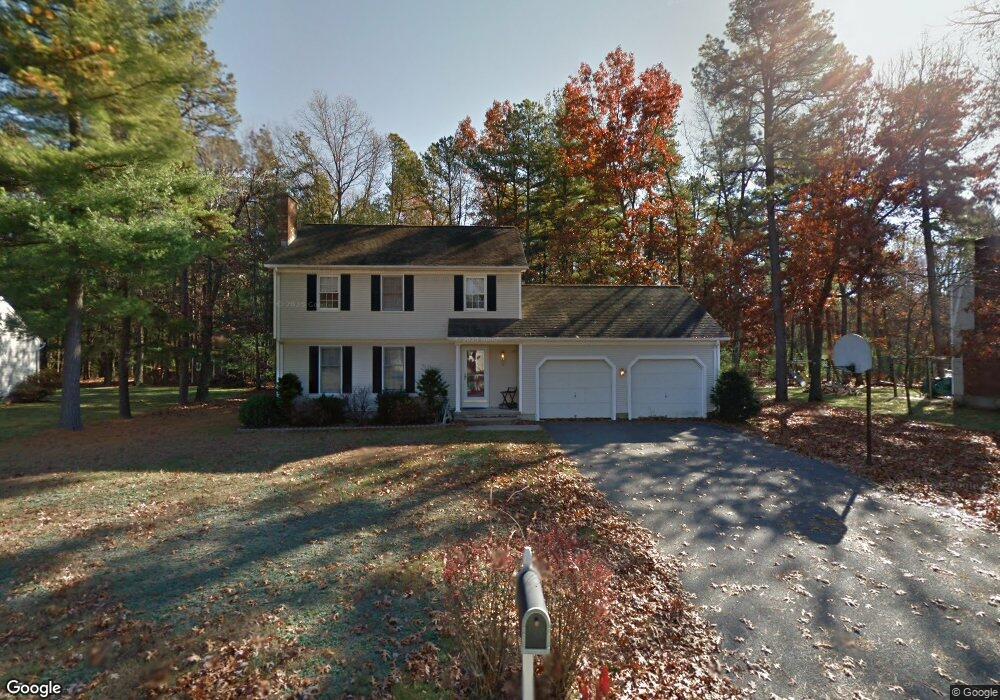
16 Kimberly Ln Easthampton, MA 01027
Estimated Value: $458,000 - $508,000
3
Beds
2
Baths
1,500
Sq Ft
$319/Sq Ft
Est. Value
About This Home
This home is located at 16 Kimberly Ln, Easthampton, MA 01027 and is currently estimated at $478,161, approximately $318 per square foot. 16 Kimberly Ln is a home located in Hampshire County with nearby schools including Easthampton High School, Calvary Baptist Christian School, and Tri-County Schools.
Ownership History
Date
Name
Owned For
Owner Type
Purchase Details
Closed on
Nov 30, 1994
Sold by
Youmell Edward D and Youmell Molly M
Bought by
Edwards Heidi A and Edwards Brian M
Current Estimated Value
Home Financials for this Owner
Home Financials are based on the most recent Mortgage that was taken out on this home.
Original Mortgage
$104,800
Interest Rate
8.81%
Mortgage Type
Purchase Money Mortgage
Create a Home Valuation Report for This Property
The Home Valuation Report is an in-depth analysis detailing your home's value as well as a comparison with similar homes in the area
Home Values in the Area
Average Home Value in this Area
Purchase History
| Date | Buyer | Sale Price | Title Company |
|---|---|---|---|
| Edwards Heidi A | $131,000 | -- |
Source: Public Records
Mortgage History
| Date | Status | Borrower | Loan Amount |
|---|---|---|---|
| Open | Edwards Heidi A | $55,000 | |
| Open | Edwards Heidi A | $96,500 | |
| Closed | Edwards Heidi A | $104,800 |
Source: Public Records
Tax History
| Year | Tax Paid | Tax Assessment Tax Assessment Total Assessment is a certain percentage of the fair market value that is determined by local assessors to be the total taxable value of land and additions on the property. | Land | Improvement |
|---|---|---|---|---|
| 2025 | $5,551 | $406,100 | $123,800 | $282,300 |
| 2024 | $5,348 | $394,400 | $120,000 | $274,400 |
| 2023 | $4,029 | $275,000 | $94,800 | $180,200 |
| 2022 | $4,546 | $275,000 | $94,800 | $180,200 |
| 2021 | $4,995 | $284,800 | $94,800 | $190,000 |
| 2020 | $4,884 | $275,000 | $94,800 | $180,200 |
| 2019 | $4,119 | $266,400 | $94,800 | $171,600 |
| 2018 | $3,965 | $247,800 | $89,600 | $158,200 |
| 2017 | $3,869 | $238,700 | $86,200 | $152,500 |
| 2016 | $3,854 | $247,200 | $86,200 | $161,000 |
| 2015 | $3,745 | $247,200 | $86,200 | $161,000 |
Source: Public Records
Map
Nearby Homes
Your Personal Tour Guide
Ask me questions while you tour the home.