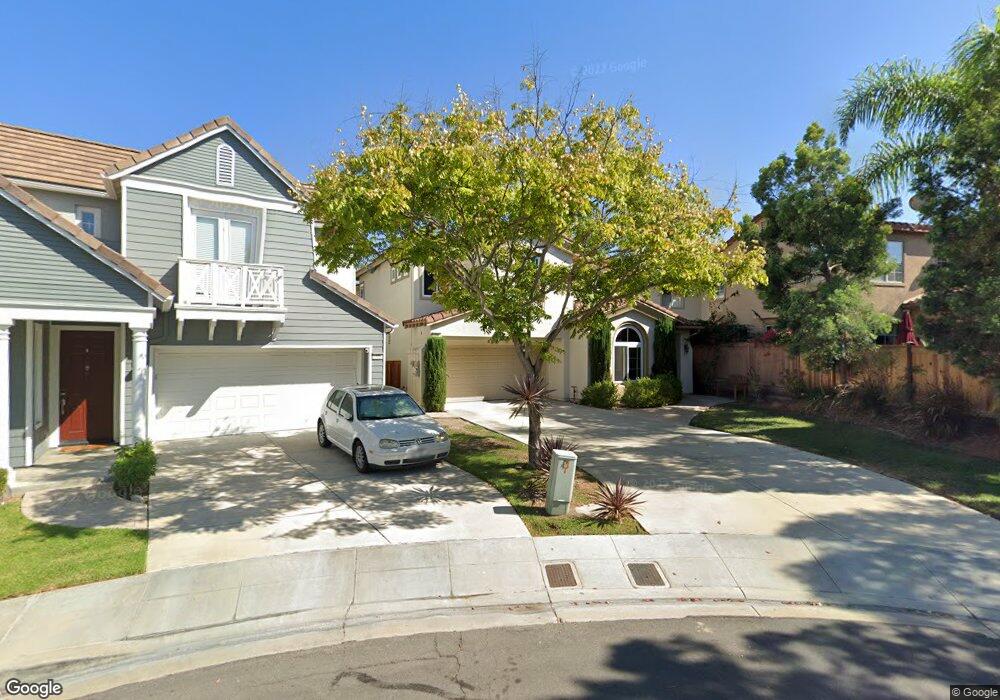
16 Kyle Ct Ladera Ranch, CA 92694
Estimated Value: $1,302,000 - $1,360,000
4
Beds
3
Baths
1,855
Sq Ft
$715/Sq Ft
Est. Value
About This Home
This home is located at 16 Kyle Ct, Ladera Ranch, CA 92694 and is currently estimated at $1,326,716, approximately $715 per square foot. 16 Kyle Ct is a home located in Orange County with nearby schools including Chaparral Elementary School, Ladera Ranch Middle School, and Tesoro High School.
Ownership History
Date
Name
Owned For
Owner Type
Purchase Details
Closed on
Nov 6, 2019
Sold by
Rutledge Armando and Rutledge Lisa
Bought by
Rutledge Armando P and Rutledge Lisa K
Current Estimated Value
Purchase Details
Closed on
Jul 7, 2000
Sold by
Sch Housing #6 Llc
Bought by
Rutledge Armando and Rutledge Lisa
Home Financials for this Owner
Home Financials are based on the most recent Mortgage that was taken out on this home.
Original Mortgage
$252,700
Outstanding Balance
$91,321
Interest Rate
8.37%
Estimated Equity
$1,235,395
Create a Home Valuation Report for This Property
The Home Valuation Report is an in-depth analysis detailing your home's value as well as a comparison with similar homes in the area
Home Values in the Area
Average Home Value in this Area
Purchase History
| Date | Buyer | Sale Price | Title Company |
|---|---|---|---|
| Rutledge Armando P | -- | None Available | |
| Rutledge Armando | $317,000 | First American Title Ins Co |
Source: Public Records
Mortgage History
| Date | Status | Borrower | Loan Amount |
|---|---|---|---|
| Open | Rutledge Armando | $252,700 | |
| Closed | Rutledge Armando | $15,000 |
Source: Public Records
Tax History
| Year | Tax Paid | Tax Assessment Tax Assessment Total Assessment is a certain percentage of the fair market value that is determined by local assessors to be the total taxable value of land and additions on the property. | Land | Improvement |
|---|---|---|---|---|
| 2025 | $6,685 | $477,659 | $244,882 | $232,777 |
| 2024 | $6,685 | $468,294 | $240,081 | $228,213 |
| 2023 | $6,572 | $459,112 | $235,373 | $223,739 |
| 2022 | $6,448 | $450,110 | $230,758 | $219,352 |
| 2021 | $6,341 | $441,285 | $226,234 | $215,051 |
| 2020 | $6,242 | $436,761 | $223,915 | $212,846 |
| 2019 | $6,266 | $428,198 | $219,525 | $208,673 |
| 2018 | $6,247 | $419,802 | $215,220 | $204,582 |
| 2017 | $6,318 | $411,571 | $211,000 | $200,571 |
| 2016 | $6,255 | $403,501 | $206,862 | $196,639 |
| 2015 | $6,332 | $397,441 | $203,755 | $193,686 |
| 2014 | $6,344 | $389,656 | $199,764 | $189,892 |
Source: Public Records
Map
Nearby Homes
Your Personal Tour Guide
Ask me questions while you tour the home.