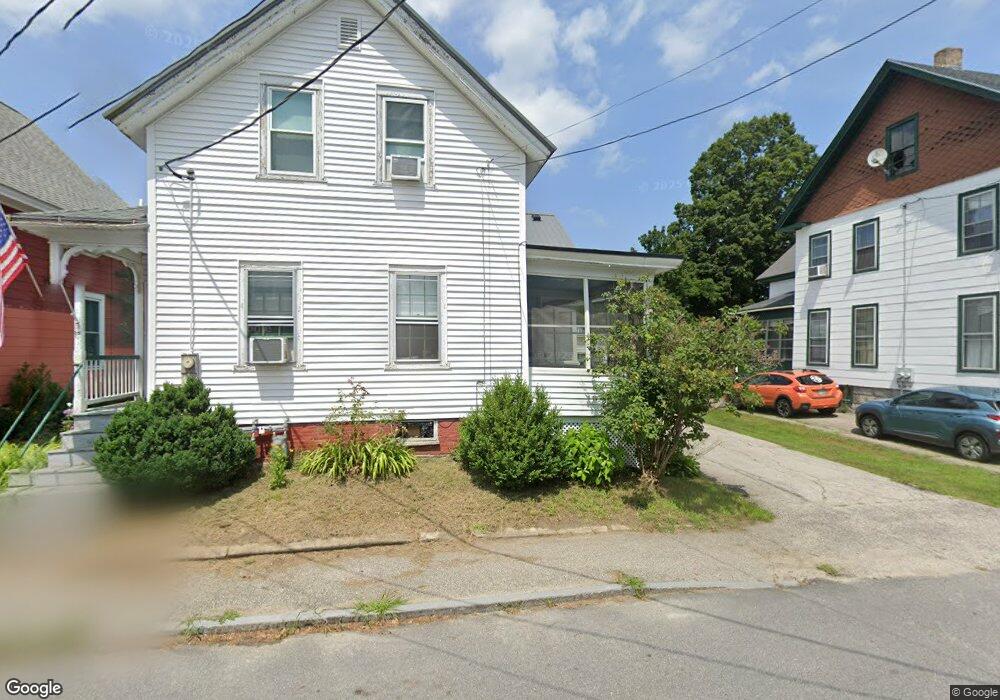
16 Laurel St Unit 18 Concord, NH 03301
South End NeighborhoodEstimated Value: $456,000 - $581,000
6
Beds
2
Baths
2,133
Sq Ft
$235/Sq Ft
Est. Value
About This Home
This home is located at 16 Laurel St Unit 18, Concord, NH 03301 and is currently estimated at $501,931, approximately $235 per square foot. 16 Laurel St Unit 18 is a home located in Merrimack County with nearby schools including Christa McAuliffe School, Rundlett Middle School, and Concord High School.
Ownership History
Date
Name
Owned For
Owner Type
Purchase Details
Closed on
Sep 4, 2024
Sold by
Lemire Russell D and Lemire Valerie A
Bought by
Shaun Bilodeau Ft and Bilodeau
Current Estimated Value
Home Financials for this Owner
Home Financials are based on the most recent Mortgage that was taken out on this home.
Original Mortgage
$321,500
Outstanding Balance
$317,799
Interest Rate
6.78%
Mortgage Type
Purchase Money Mortgage
Estimated Equity
$184,132
Purchase Details
Closed on
Jul 16, 2008
Sold by
Faretra Ruth Boisvert
Bought by
Lemire Russell D and Lemire Valerie A
Create a Home Valuation Report for This Property
The Home Valuation Report is an in-depth analysis detailing your home's value as well as a comparison with similar homes in the area
Home Values in the Area
Average Home Value in this Area
Purchase History
| Date | Buyer | Sale Price | Title Company |
|---|---|---|---|
| Shaun Bilodeau Ft | $505,000 | None Available | |
| Shaun Bilodeau Ft | $505,000 | None Available | |
| Lemire Russell D | $241,500 | -- | |
| Lemire Russell D | $241,500 | -- |
Source: Public Records
Mortgage History
| Date | Status | Borrower | Loan Amount |
|---|---|---|---|
| Open | Shaun Bilodeau Ft | $321,500 | |
| Closed | Shaun Bilodeau Ft | $321,500 | |
| Previous Owner | Lemire Russell D | $234,276 | |
| Previous Owner | Lemire Russell D | $239,882 | |
| Previous Owner | Lemire Russell D | $241,265 |
Source: Public Records
Tax History Compared to Growth
Tax History
| Year | Tax Paid | Tax Assessment Tax Assessment Total Assessment is a certain percentage of the fair market value that is determined by local assessors to be the total taxable value of land and additions on the property. | Land | Improvement |
|---|---|---|---|---|
| 2024 | $6,795 | $245,400 | $89,800 | $155,600 |
| 2023 | $6,591 | $245,400 | $89,800 | $155,600 |
| 2022 | $6,340 | $244,900 | $89,800 | $155,100 |
| 2021 | $6,152 | $244,900 | $89,800 | $155,100 |
| 2020 | $5,435 | $203,100 | $71,700 | $131,400 |
| 2019 | $4,889 | $176,000 | $66,500 | $109,500 |
| 2018 | $4,860 | $172,400 | $66,500 | $105,900 |
| 2017 | $4,688 | $166,000 | $66,500 | $99,500 |
| 2016 | $4,480 | $161,900 | $66,500 | $95,400 |
| 2015 | $4,202 | $153,700 | $65,200 | $88,500 |
| 2014 | $4,121 | $153,700 | $65,200 | $88,500 |
| 2013 | -- | $155,400 | $65,200 | $90,200 |
| 2012 | $3,590 | $147,300 | $65,200 | $82,100 |
Source: Public Records
Map
Nearby Homes
- 14 Downing St
- 24 Pierce St
- 10 Perley St
- 47 South St
- 0 Spruce St Unit 88
- 26 South St
- 33 Spruce St
- 4 Fayette St
- 54 Pleasant St Unit 8
- 122 South St
- 105 S Main St
- 0 South St Unit 4969509
- 5 Broad Ave
- 2 Kensington Rd
- 1 Kensington Rd
- 30 Jackson St
- 7 Highridge Trail
- 24 Hazel Dr
- 6 Lawrence Street Extension
- 69 Manchester St Unit Lot 18