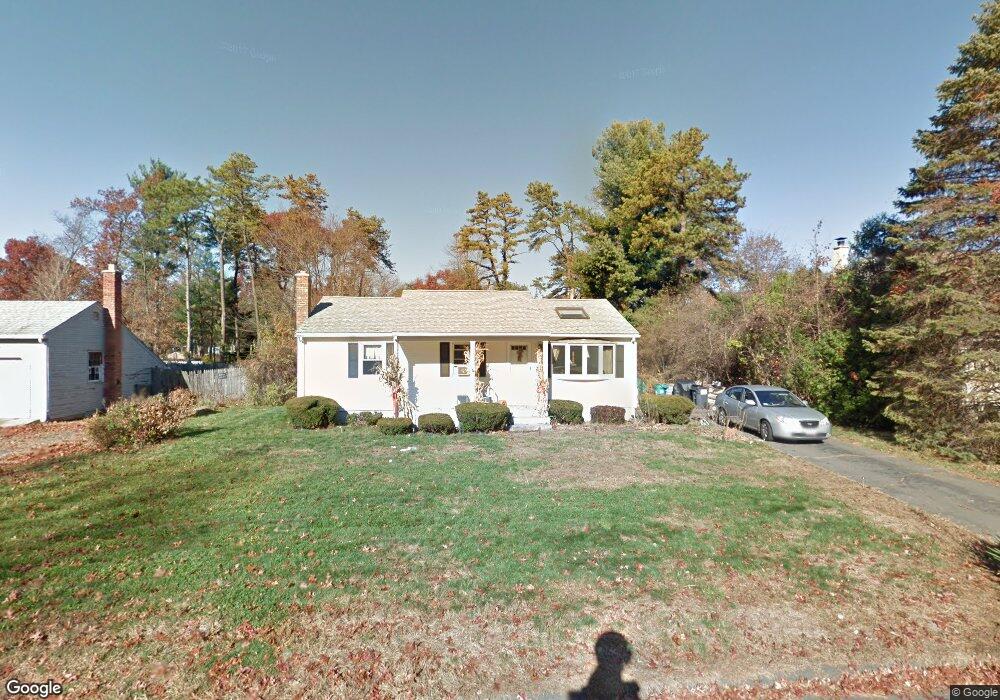
16 Lawson Dr Easthampton, MA 01027
Estimated Value: $324,000 - $349,000
3
Beds
2
Baths
960
Sq Ft
$351/Sq Ft
Est. Value
About This Home
This home is located at 16 Lawson Dr, Easthampton, MA 01027 and is currently estimated at $336,877, approximately $350 per square foot. 16 Lawson Dr is a home located in Hampshire County with nearby schools including Easthampton High School, Hilltown Cooperative Charter Public School, and Calvary Baptist Christian School.
Ownership History
Date
Name
Owned For
Owner Type
Purchase Details
Closed on
May 2, 2000
Sold by
Hodgdon Bradley P and Hodgdon Cherie A
Bought by
Obrien Kathleen A and Tessier Martin L
Current Estimated Value
Home Financials for this Owner
Home Financials are based on the most recent Mortgage that was taken out on this home.
Original Mortgage
$87,200
Interest Rate
8.23%
Mortgage Type
Purchase Money Mortgage
Purchase Details
Closed on
Jun 29, 1990
Sold by
Fundakowski Bogdan
Bought by
Yvon Michael S
Home Financials for this Owner
Home Financials are based on the most recent Mortgage that was taken out on this home.
Original Mortgage
$113,367
Interest Rate
10.27%
Mortgage Type
Purchase Money Mortgage
Create a Home Valuation Report for This Property
The Home Valuation Report is an in-depth analysis detailing your home's value as well as a comparison with similar homes in the area
Home Values in the Area
Average Home Value in this Area
Purchase History
| Date | Buyer | Sale Price | Title Company |
|---|---|---|---|
| Obrien Kathleen A | $109,000 | -- | |
| Yvon Michael S | $112,000 | -- |
Source: Public Records
Mortgage History
| Date | Status | Borrower | Loan Amount |
|---|---|---|---|
| Open | Yvon Michael S | $101,000 | |
| Closed | Yvon Michael S | $87,200 | |
| Previous Owner | Yvon Michael S | $115,529 | |
| Previous Owner | Yvon Michael S | $113,367 |
Source: Public Records
Tax History
| Year | Tax Paid | Tax Assessment Tax Assessment Total Assessment is a certain percentage of the fair market value that is determined by local assessors to be the total taxable value of land and additions on the property. | Land | Improvement |
|---|---|---|---|---|
| 2025 | $4,422 | $323,500 | $118,300 | $205,200 |
| 2024 | $4,354 | $321,100 | $114,900 | $206,200 |
| 2023 | $3,298 | $225,100 | $90,400 | $134,700 |
| 2022 | $3,721 | $225,100 | $90,400 | $134,700 |
| 2021 | $4,068 | $231,900 | $90,400 | $141,500 |
| 2020 | $3,998 | $225,100 | $90,400 | $134,700 |
| 2019 | $3,117 | $201,600 | $90,400 | $111,200 |
| 2018 | $2,990 | $186,900 | $85,400 | $101,500 |
| 2017 | $2,916 | $179,900 | $82,100 | $97,800 |
| 2016 | $3,009 | $193,000 | $82,100 | $110,900 |
| 2015 | $2,924 | $193,000 | $82,100 | $110,900 |
Source: Public Records
Map
Nearby Homes
Your Personal Tour Guide
Ask me questions while you tour the home.