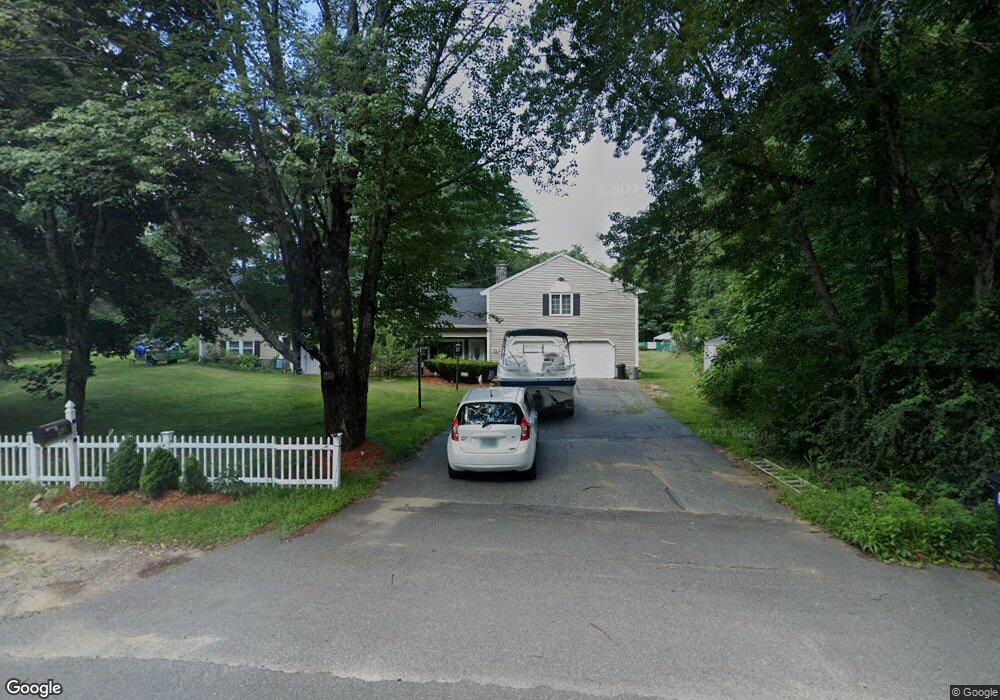
16 Lowell Rd Windham, NH 03087
Estimated Value: $202,000 - $559,000
3
Beds
2
Baths
1,042
Sq Ft
$424/Sq Ft
Est. Value
About This Home
This home is located at 16 Lowell Rd, Windham, NH 03087 and is currently estimated at $441,907, approximately $424 per square foot. 16 Lowell Rd is a home located in Rockingham County with nearby schools including Golden Brook Elementary School, Windham Middle School, and Windham High School.
Ownership History
Date
Name
Owned For
Owner Type
Purchase Details
Closed on
Jun 17, 2022
Sold by
Pincince Anthony
Bought by
Pincince Anthony and Pincince Lesley M
Current Estimated Value
Purchase Details
Closed on
May 27, 2021
Sold by
Troy Jennifer and Goodwin David
Bought by
Pincince Anthony
Create a Home Valuation Report for This Property
The Home Valuation Report is an in-depth analysis detailing your home's value as well as a comparison with similar homes in the area
Home Values in the Area
Average Home Value in this Area
Purchase History
| Date | Buyer | Sale Price | Title Company |
|---|---|---|---|
| Pincince Anthony | -- | None Available | |
| Pincince Anthony | -- | None Available | |
| Pincince Anthony | -- | None Available | |
| Pincince Anthony | $135,333 | None Available | |
| Pincince Anthony | -- | None Available | |
| Pincince Anthony | $135,333 | None Available |
Source: Public Records
Tax History
| Year | Tax Paid | Tax Assessment Tax Assessment Total Assessment is a certain percentage of the fair market value that is determined by local assessors to be the total taxable value of land and additions on the property. | Land | Improvement |
|---|---|---|---|---|
| 2024 | $6,293 | $277,980 | $159,780 | $118,200 |
| 2023 | $5,949 | $277,980 | $159,780 | $118,200 |
| 2022 | $5,493 | $277,980 | $159,780 | $118,200 |
| 2021 | $5,190 | $278,740 | $159,940 | $118,800 |
| 2020 | $5,321 | $278,160 | $159,960 | $118,200 |
| 2019 | $4,756 | $210,920 | $147,020 | $63,900 |
| 2018 | $4,912 | $210,920 | $147,020 | $63,900 |
| 2017 | $4,260 | $210,880 | $146,980 | $63,900 |
| 2016 | $4,602 | $210,920 | $147,020 | $63,900 |
| 2015 | $4,580 | $210,880 | $146,980 | $63,900 |
| 2014 | $5,424 | $225,980 | $177,780 | $48,200 |
| 2013 | $5,428 | $230,000 | $178,900 | $51,100 |
Source: Public Records
Map
Nearby Homes
- 47 Cobbetts Pond Rd
- 4 Arbor Rd
- 16 Arbor Rd
- 98 Trails Edge Rd
- 50 Cobbetts Pond Rd
- 45 Stacey Cir
- 210 Range Rd
- 54 Enterprise Dr
- 6 Chadwick Cir
- 18 Highclere Rd
- 14 Londonderry Rd
- 5 Johnson St
- 108 S Shore Rd
- 23 Ryan Farm Rd
- 22 Ryan Farm Rd
- 90 N Lowell Rd
- 39 Overton Rd
- 2 Mulberry St
- 12 Shelly Dr
- 2 Cypress Ln
Your Personal Tour Guide
Ask me questions while you tour the home.