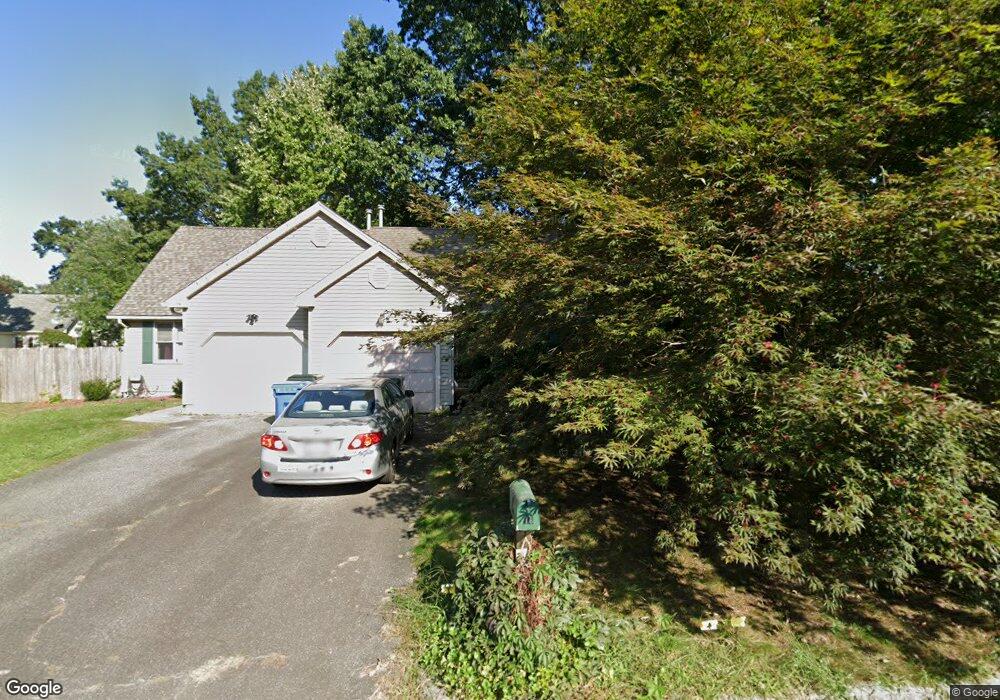
16 Luden St Springfield, MA 01118
East Forest Park NeighborhoodEstimated Value: $255,000 - $285,000
2
Beds
2
Baths
1,050
Sq Ft
$262/Sq Ft
Est. Value
About This Home
This home is located at 16 Luden St, Springfield, MA 01118 and is currently estimated at $275,117, approximately $262 per square foot. 16 Luden St is a home located in Hampden County with nearby schools including Frederick Harris Elementary School, M Marcus Kiley Middle, and Springfield High School of Science and Technology.
Ownership History
Date
Name
Owned For
Owner Type
Purchase Details
Closed on
Jun 28, 1995
Sold by
Fitpatrick June L
Bought by
Solzak Sharon A
Current Estimated Value
Home Financials for this Owner
Home Financials are based on the most recent Mortgage that was taken out on this home.
Original Mortgage
$55,000
Interest Rate
7.8%
Mortgage Type
Purchase Money Mortgage
Purchase Details
Closed on
Aug 26, 1988
Sold by
Equity One Re & Dev
Bought by
Perella June L
Home Financials for this Owner
Home Financials are based on the most recent Mortgage that was taken out on this home.
Original Mortgage
$72,700
Interest Rate
10.36%
Mortgage Type
Purchase Money Mortgage
Create a Home Valuation Report for This Property
The Home Valuation Report is an in-depth analysis detailing your home's value as well as a comparison with similar homes in the area
Home Values in the Area
Average Home Value in this Area
Purchase History
| Date | Buyer | Sale Price | Title Company |
|---|---|---|---|
| Solzak Sharon A | $69,000 | -- | |
| Perella June L | $92,000 | -- |
Source: Public Records
Mortgage History
| Date | Status | Borrower | Loan Amount |
|---|---|---|---|
| Closed | Perella June L | $55,000 | |
| Previous Owner | Perella June L | $72,700 |
Source: Public Records
Tax History
| Year | Tax Paid | Tax Assessment Tax Assessment Total Assessment is a certain percentage of the fair market value that is determined by local assessors to be the total taxable value of land and additions on the property. | Land | Improvement |
|---|---|---|---|---|
| 2025 | $3,294 | $210,100 | $47,000 | $163,100 |
| 2024 | $3,103 | $193,200 | $47,000 | $146,200 |
| 2023 | $2,974 | $174,400 | $44,800 | $129,600 |
| 2022 | $3,258 | $173,100 | $44,800 | $128,300 |
| 2021 | $2,880 | $152,400 | $40,700 | $111,700 |
| 2020 | $2,639 | $135,100 | $40,700 | $94,400 |
| 2019 | $2,413 | $122,600 | $40,700 | $81,900 |
| 2018 | $2,491 | $126,600 | $40,700 | $85,900 |
| 2017 | $2,809 | $142,900 | $40,700 | $102,200 |
| 2016 | $2,570 | $130,700 | $40,700 | $90,000 |
| 2015 | $2,555 | $129,900 | $40,700 | $89,200 |
Source: Public Records
Map
Nearby Homes
- 116 Carr St
- 19 Orpheum Ave
- 119 Powell Ave
- 26 Dwight Rd
- 161 Dorset St
- 46 Hadley St
- 38 Manchester Terrace
- 78 Wood Ave
- 33-35 Ruskin St
- 13 Bither St
- 34 Castle St
- 77 Dorset St
- 1088 Sumner Ave
- 914-916 Belmont Ave
- 29 Eddywood St
- 70 Hartwick St
- 69 Belvidere St
- 46 Eckington St
- 147 Belvidere St
- 43 Morningside Park
Your Personal Tour Guide
Ask me questions while you tour the home.