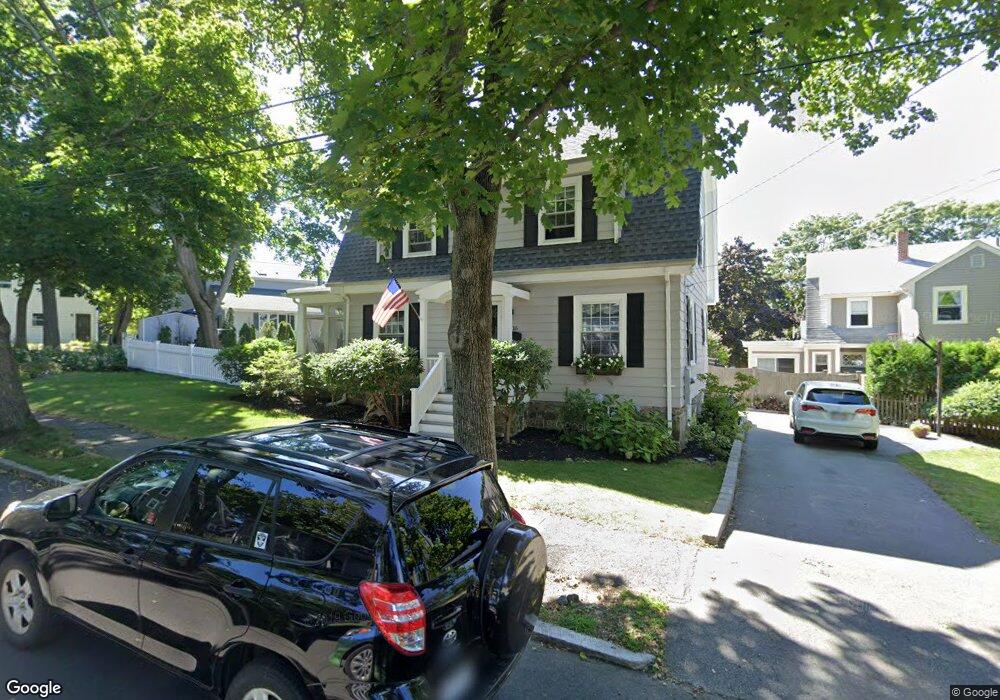
16 Magnolia Rd Swampscott, MA 01907
Estimated Value: $843,895 - $911,000
3
Beds
2
Baths
1,803
Sq Ft
$486/Sq Ft
Est. Value
About This Home
This home is located at 16 Magnolia Rd, Swampscott, MA 01907 and is currently estimated at $876,974, approximately $486 per square foot. 16 Magnolia Rd is a home located in Essex County with nearby schools including Swampscott Middle School and Swampscott High School.
Ownership History
Date
Name
Owned For
Owner Type
Purchase Details
Closed on
Jul 8, 2025
Sold by
Cavanaugh Donna M and Collins John S
Bought by
Krueger Kelly M and Morretti Nunzio
Current Estimated Value
Home Financials for this Owner
Home Financials are based on the most recent Mortgage that was taken out on this home.
Original Mortgage
$700,000
Outstanding Balance
$697,620
Interest Rate
6.86%
Mortgage Type
New Conventional
Estimated Equity
$179,354
Purchase Details
Closed on
Aug 11, 1987
Sold by
Kalikow Alan M
Bought by
Collins John S
Create a Home Valuation Report for This Property
The Home Valuation Report is an in-depth analysis detailing your home's value as well as a comparison with similar homes in the area
Home Values in the Area
Average Home Value in this Area
Purchase History
| Date | Buyer | Sale Price | Title Company |
|---|---|---|---|
| Krueger Kelly M | $900,000 | -- | |
| Krueger Kelly M | $900,000 | -- | |
| Collins John S | $221,000 | -- |
Source: Public Records
Mortgage History
| Date | Status | Borrower | Loan Amount |
|---|---|---|---|
| Open | Krueger Kelly M | $700,000 | |
| Closed | Krueger Kelly M | $700,000 | |
| Previous Owner | Collins John S | $216,000 | |
| Previous Owner | Collins John S | $235,000 |
Source: Public Records
Tax History Compared to Growth
Tax History
| Year | Tax Paid | Tax Assessment Tax Assessment Total Assessment is a certain percentage of the fair market value that is determined by local assessors to be the total taxable value of land and additions on the property. | Land | Improvement |
|---|---|---|---|---|
| 2025 | $8,195 | $714,500 | $356,900 | $357,600 |
| 2024 | $7,961 | $692,900 | $339,500 | $353,400 |
| 2023 | $7,414 | $631,500 | $304,700 | $326,800 |
| 2022 | $7,049 | $549,400 | $261,100 | $288,300 |
| 2021 | $6,965 | $504,700 | $243,700 | $261,000 |
| 2020 | $6,784 | $474,400 | $217,600 | $256,800 |
| 2019 | $6,638 | $436,700 | $195,800 | $240,900 |
| 2018 | $6,552 | $409,500 | $178,400 | $231,100 |
| 2017 | $6,673 | $382,400 | $167,100 | $215,300 |
| 2016 | $6,627 | $382,400 | $167,100 | $215,300 |
| 2015 | $6,558 | $382,400 | $167,100 | $215,300 |
| 2014 | $6,244 | $333,900 | $139,300 | $194,600 |
Source: Public Records
Map
Nearby Homes
- 8 Ocean View Rd
- 75 Bay View Dr
- 21 Bay View Dr
- 13 Cedar Hill Terrace Unit 2
- 71 Walnut Rd
- 71 Greenwood Ave Unit 207
- 309 Paradise Rd
- 140 Elmwood Rd
- 306 Paradise Rd
- 35 Alden Rd
- 24 Orchard Cir
- 98 Paradise Rd
- 110 Galloupes Point Rd
- 51 Barnstable St
- 76 Stetson Ave
- 30 Paradise Rd
- 28 Claremont Terrace Unit 4
- 28 Claremont Terrace Unit 6
- 106 Norfolk Ave
- 10-12 Fairview Ave