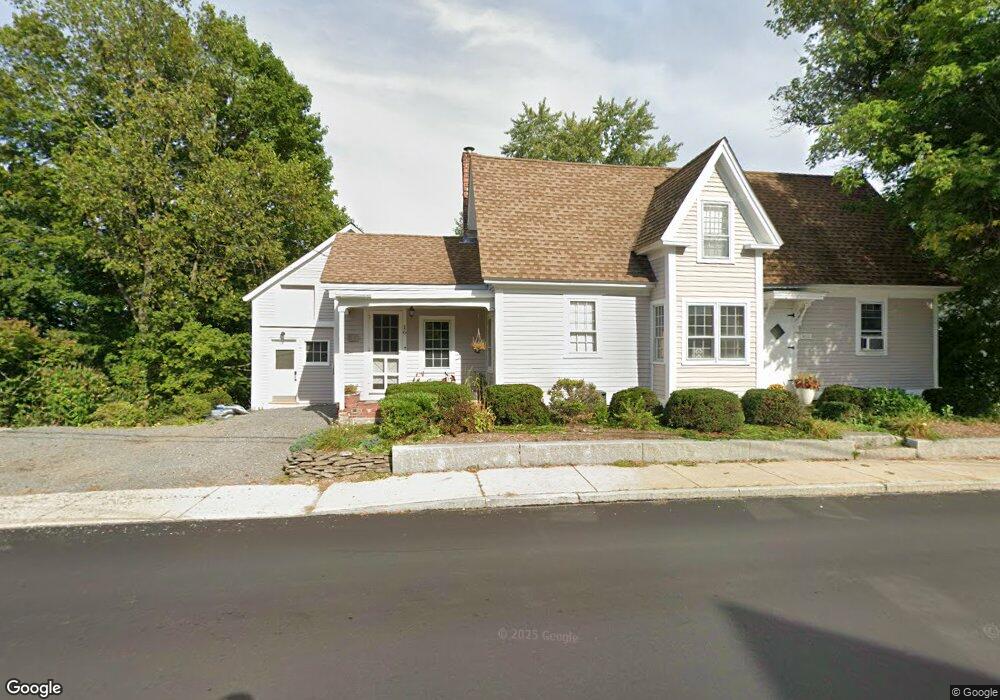
16 Main St Hollis, NH 03049
Hollis NeighborhoodEstimated Value: $455,000 - $746,000
3
Beds
2
Baths
1,002
Sq Ft
$585/Sq Ft
Est. Value
About This Home
This home is located at 16 Main St, Hollis, NH 03049 and is currently estimated at $585,915, approximately $584 per square foot. 16 Main St is a home with nearby schools including Hollis Primary School, Hollis Upper Elementary School, and Hollis-Brookline Middle School.
Ownership History
Date
Name
Owned For
Owner Type
Purchase Details
Closed on
Feb 8, 2023
Sold by
Bell Thomas R
Bought by
Thomas R Bell Ret
Current Estimated Value
Purchase Details
Closed on
Nov 24, 1998
Sold by
Carlson Jane
Bought by
Bell Thomas R
Home Financials for this Owner
Home Financials are based on the most recent Mortgage that was taken out on this home.
Original Mortgage
$152,380
Interest Rate
6.49%
Create a Home Valuation Report for This Property
The Home Valuation Report is an in-depth analysis detailing your home's value as well as a comparison with similar homes in the area
Home Values in the Area
Average Home Value in this Area
Purchase History
| Date | Buyer | Sale Price | Title Company |
|---|---|---|---|
| Thomas R Bell Ret | -- | None Available | |
| Bell Thomas R | $160,400 | -- |
Source: Public Records
Mortgage History
| Date | Status | Borrower | Loan Amount |
|---|---|---|---|
| Previous Owner | Bell Thomas R | $30,000 | |
| Previous Owner | Bell Thomas R | $152,380 |
Source: Public Records
Tax History Compared to Growth
Tax History
| Year | Tax Paid | Tax Assessment Tax Assessment Total Assessment is a certain percentage of the fair market value that is determined by local assessors to be the total taxable value of land and additions on the property. | Land | Improvement |
|---|---|---|---|---|
| 2024 | $6,769 | $381,800 | $200,200 | $181,600 |
| 2023 | $6,361 | $381,800 | $200,200 | $181,600 |
| 2022 | $8,617 | $381,800 | $200,200 | $181,600 |
| 2021 | $5,693 | $250,800 | $115,600 | $135,200 |
| 2020 | $6,672 | $250,800 | $115,600 | $135,200 |
| 2019 | $0 | $250,800 | $115,600 | $135,200 |
| 2018 | $6,626 | $250,800 | $115,600 | $135,200 |
| 2017 | $4,848 | $209,400 | $97,200 | $112,200 |
| 2016 | $6,565 | $209,400 | $97,200 | $112,200 |
| 2015 | $4,664 | $202,600 | $97,200 | $105,400 |
| 2014 | $4,665 | $201,700 | $96,300 | $105,400 |
| 2013 | $4,596 | $201,400 | $96,300 | $105,100 |
Source: Public Records
Map
Nearby Homes