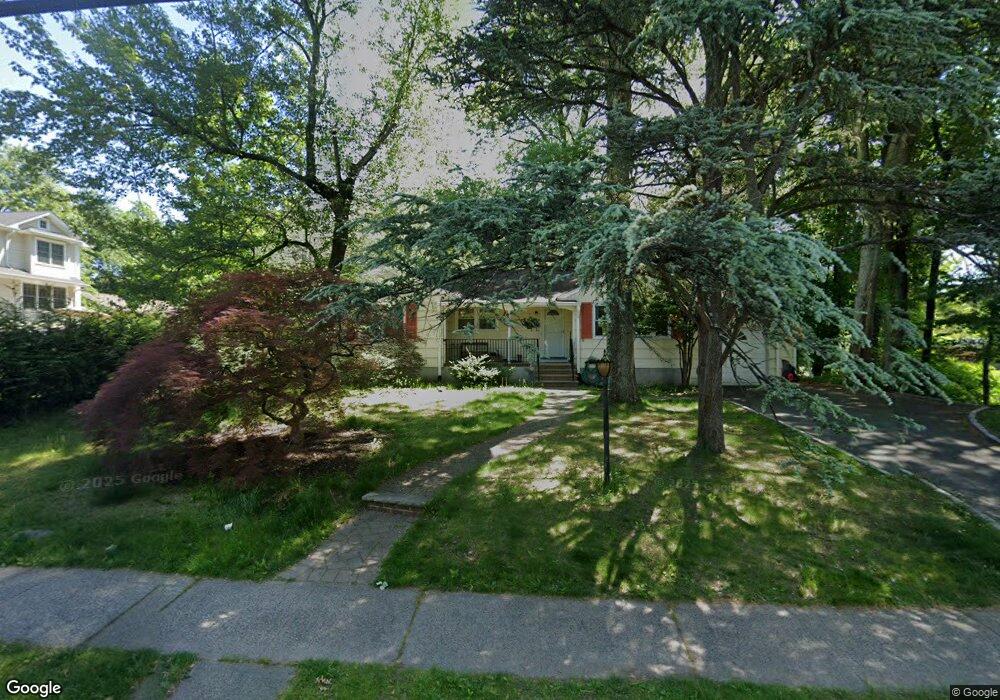
16 Maple St New Providence, NJ 07974
Estimated Value: $746,000 - $778,532
--
Bed
--
Bath
1,230
Sq Ft
$616/Sq Ft
Est. Value
About This Home
This home is located at 16 Maple St, New Providence, NJ 07974 and is currently estimated at $757,383, approximately $615 per square foot. 16 Maple St is a home located in Union County with nearby schools including New Providence High School, The Academy of Our Lady of Peace, and Oak Knoll School of the Holy Child.
Ownership History
Date
Name
Owned For
Owner Type
Purchase Details
Closed on
Sep 22, 2015
Sold by
Fitch Allison C and Fitch Hirschey,Tyler S
Bought by
Hirschey Allison C and Hirschey Tyler S
Current Estimated Value
Purchase Details
Closed on
Jul 16, 2009
Sold by
Li Lingang and Wang Kun
Bought by
Fitch Allison Courtney and Hirschey Tyler Steven
Home Financials for this Owner
Home Financials are based on the most recent Mortgage that was taken out on this home.
Original Mortgage
$309,320
Interest Rate
5.47%
Mortgage Type
FHA
Purchase Details
Closed on
Aug 29, 2002
Sold by
Lee Steven
Bought by
Lingang Li and Wang Kun
Home Financials for this Owner
Home Financials are based on the most recent Mortgage that was taken out on this home.
Original Mortgage
$249,600
Interest Rate
6.36%
Purchase Details
Closed on
Feb 3, 1998
Sold by
Lee Patriena Fu Sum
Bought by
Lee Uth
Create a Home Valuation Report for This Property
The Home Valuation Report is an in-depth analysis detailing your home's value as well as a comparison with similar homes in the area
Home Values in the Area
Average Home Value in this Area
Purchase History
| Date | Buyer | Sale Price | Title Company |
|---|---|---|---|
| Hirschey Allison C | -- | -- | |
| Fitch Allison Courtney | $380,000 | None Available | |
| Lingang Li | $312,000 | -- | |
| Lee Uth | -- | -- |
Source: Public Records
Mortgage History
| Date | Status | Borrower | Loan Amount |
|---|---|---|---|
| Previous Owner | Fitch Allison Courtney | $309,320 | |
| Previous Owner | Lingang Li | $249,600 |
Source: Public Records
Tax History Compared to Growth
Tax History
| Year | Tax Paid | Tax Assessment Tax Assessment Total Assessment is a certain percentage of the fair market value that is determined by local assessors to be the total taxable value of land and additions on the property. | Land | Improvement |
|---|---|---|---|---|
| 2025 | $11,950 | $231,500 | $134,400 | $97,100 |
| 2024 | $10,760 | $231,500 | $134,400 | $97,100 |
| 2023 | $10,760 | $214,900 | $134,400 | $80,500 |
| 2022 | $10,612 | $214,900 | $134,400 | $80,500 |
| 2021 | $10,534 | $214,900 | $134,400 | $80,500 |
| 2020 | $10,530 | $214,900 | $134,400 | $80,500 |
| 2019 | $10,466 | $214,900 | $134,400 | $80,500 |
| 2018 | $10,412 | $214,900 | $134,400 | $80,500 |
| 2017 | $10,242 | $214,900 | $134,400 | $80,500 |
| 2016 | $10,098 | $214,900 | $134,400 | $80,500 |
| 2015 | $9,500 | $205,000 | $134,400 | $70,600 |
| 2014 | $9,356 | $205,000 | $134,400 | $70,600 |
Source: Public Records
Map
Nearby Homes
- 54 Badgley Dr
- 19 Division Ave
- 72 Central Ave
- 197 Elkwood Ave
- 43 Passaic Ave
- 106 Stoneridge Rd
- 1200 Springfield Ave Unit 1B
- 17 Valley View Ave
- 34 Grant Ave
- 283 Riveredge Dr
- 100 Commonwealth Ave
- 146 Riveredge Dr
- 709 Springfield Ave Unit 4
- 709 Springfield Ave Unit 3
- 175 Terrace Dr
- 45 the Fellsway
- 7 Oak Forest Ln
- 29 Walton Ave
- 32 Marion Ave
- 2F Terrace Dr Unit F
- 930 Springfield Ave
- 946 Springfield Ave
- 17 Maple St
- 21 Maple St
- 924 Springfield Ave
- 952 Springfield Ave
- 27 Maple St
- 31 Maple St
- 960 Springfield Ave
- 35 Maple St
- 929 Springfield Ave
- 939 Springfield Ave
- 915 Springfield Ave
- 949 Springfield Ave
- 41 Maple St
- 911 Springfield Ave
- 913 Springfield Ave
- 18 Mill Pond Rd
- 959 Springfield Ave
- 45 Maple St