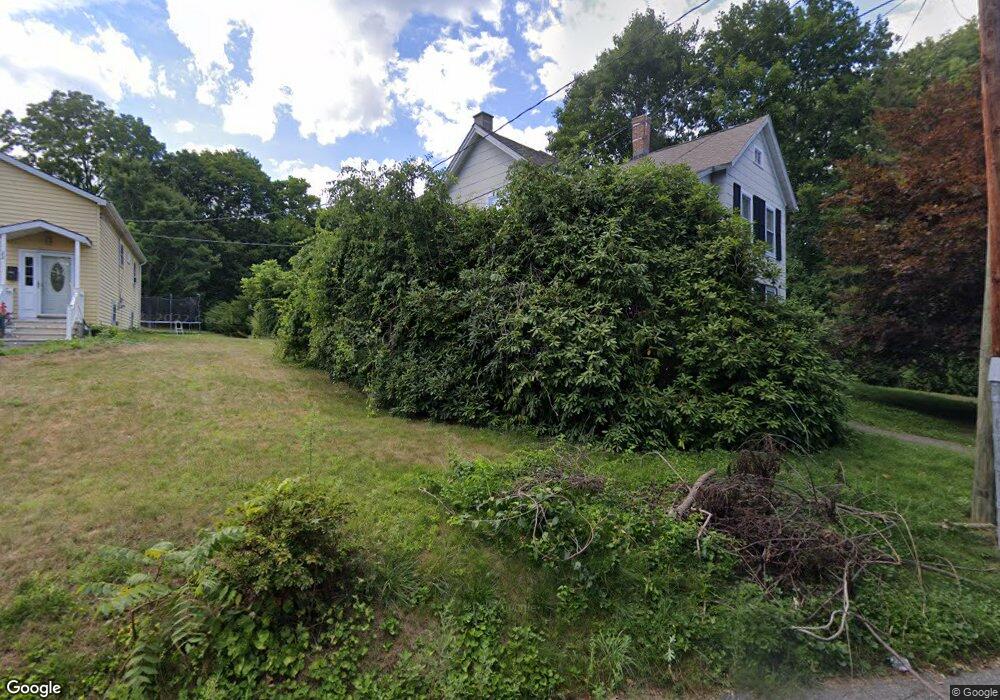
16 Maple St Torrington, CT 06790
Estimated Value: $246,000 - $288,000
3
Beds
2
Baths
1,393
Sq Ft
$192/Sq Ft
Est. Value
About This Home
This home is located at 16 Maple St, Torrington, CT 06790 and is currently estimated at $267,333, approximately $191 per square foot. 16 Maple St is a home located in Litchfield County with nearby schools including Torrington Middle School, Torrington High School, and St. Peter School.
Ownership History
Date
Name
Owned For
Owner Type
Purchase Details
Closed on
Jan 16, 2007
Sold by
Phillips Shannon L
Bought by
Mclean Katharine A
Current Estimated Value
Home Financials for this Owner
Home Financials are based on the most recent Mortgage that was taken out on this home.
Original Mortgage
$135,000
Interest Rate
6.18%
Purchase Details
Closed on
Mar 24, 2005
Sold by
Kandefer Mary Alice
Bought by
Phillips Shannon L
Home Financials for this Owner
Home Financials are based on the most recent Mortgage that was taken out on this home.
Original Mortgage
$127,950
Interest Rate
5.56%
Purchase Details
Closed on
Oct 15, 2003
Sold by
Murphy Timothy P
Bought by
Kandefer Mary Alice E
Purchase Details
Closed on
Jan 19, 2001
Sold by
Charter Travis J
Bought by
Murphy Timothy P
Purchase Details
Closed on
Mar 16, 1994
Sold by
Ctb Ventures 43 Inc
Bought by
Charter Travis J
Create a Home Valuation Report for This Property
The Home Valuation Report is an in-depth analysis detailing your home's value as well as a comparison with similar homes in the area
Home Values in the Area
Average Home Value in this Area
Purchase History
| Date | Buyer | Sale Price | Title Company |
|---|---|---|---|
| Mclean Katharine A | $172,000 | -- | |
| Phillips Shannon L | $130,000 | -- | |
| Kandefer Mary Alice E | $105,000 | -- | |
| Murphy Timothy P | $85,000 | -- | |
| Charter Travis J | $70,000 | -- |
Source: Public Records
Mortgage History
| Date | Status | Borrower | Loan Amount |
|---|---|---|---|
| Open | Charter Travis J | $95,000 | |
| Closed | Charter Travis J | $135,000 | |
| Previous Owner | Charter Travis J | $127,950 |
Source: Public Records
Tax History
| Year | Tax Paid | Tax Assessment Tax Assessment Total Assessment is a certain percentage of the fair market value that is determined by local assessors to be the total taxable value of land and additions on the property. | Land | Improvement |
|---|---|---|---|---|
| 2025 | $5,849 | $152,110 | $24,780 | $127,330 |
| 2024 | $3,882 | $80,930 | $24,740 | $56,190 |
| 2023 | $3,881 | $80,930 | $24,740 | $56,190 |
| 2022 | $3,815 | $80,930 | $24,740 | $56,190 |
| 2021 | $3,737 | $80,930 | $24,740 | $56,190 |
| 2020 | $3,737 | $80,930 | $24,740 | $56,190 |
| 2019 | $3,372 | $73,040 | $30,400 | $42,640 |
| 2018 | $3,372 | $73,040 | $30,400 | $42,640 |
| 2017 | $3,342 | $73,040 | $30,400 | $42,640 |
| 2016 | $3,342 | $73,040 | $30,400 | $42,640 |
| 2015 | $3,342 | $73,040 | $30,400 | $42,640 |
| 2014 | $3,631 | $99,980 | $42,670 | $57,310 |
Source: Public Records
Map
Nearby Homes
- 72 French St
- 75 Maple St
- 64 Cooper St
- 68 Wilson Ave Unit 105
- 108 Culvert St
- 30 Culvert St
- 163 Beechwood Ave
- 116 High St
- 146 Beechwood Ave
- 115 Beechwood Ave
- 29 Elton St
- 264 S Main St
- 80 Washington Ave
- 398 Funston Ave
- 329 Church St
- 00 Church St
- 86 Belleview Ave
- 95 Colorado Ave N
- 199 Mckinley St
- 364 Park Ave
- 94 French St
- 22 Maple St
- 84 French St
- 72 French St Unit 1
- 72 French St Unit 3
- 72 French St Unit 2
- 28 Maple St
- 21 Roosevelt Ave
- 29 Roosevelt Ave Unit 2
- 29 Roosevelt Ave
- 99 Lafayette St
- 83 Lafayette St
- 76 French St
- 39 Roosevelt Ave
- 38 Maple St
- 38 Maple St Unit 3
- 95 Lafayette St
- 95 Lafayette St Unit 1sr flr
- 120 French St
- 45 Roosevelt Ave
Your Personal Tour Guide
Ask me questions while you tour the home.