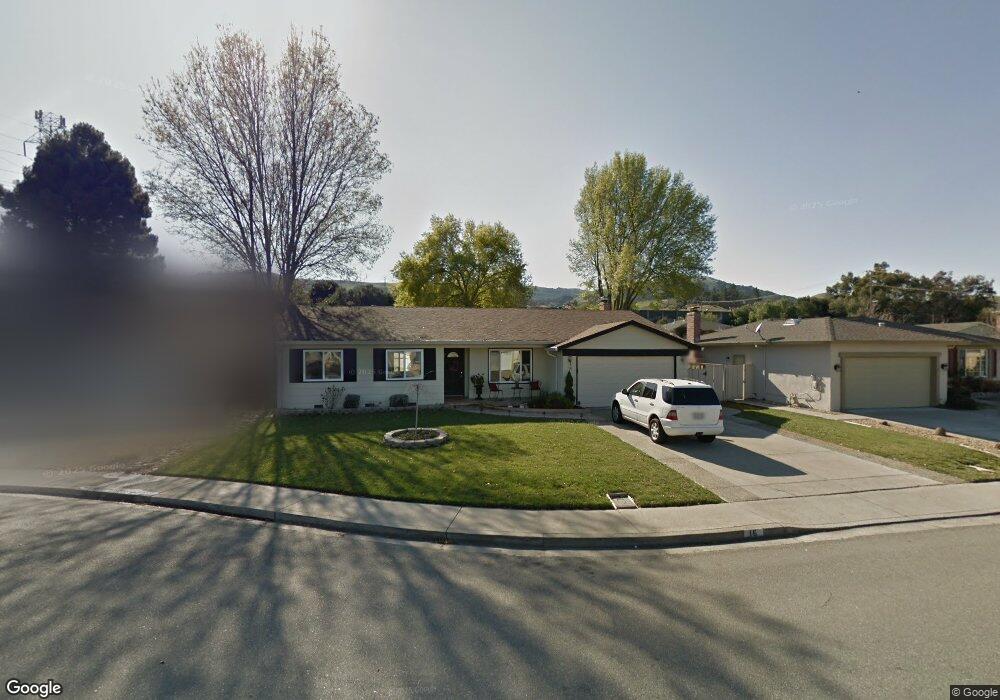
16 Marilyn Place San Ramon, CA 94583
San Ramon Valley NeighborhoodEstimated Value: $1,244,000 - $1,300,000
3
Beds
2
Baths
1,357
Sq Ft
$937/Sq Ft
Est. Value
About This Home
This home is located at 16 Marilyn Place, San Ramon, CA 94583 and is currently estimated at $1,270,924, approximately $936 per square foot. 16 Marilyn Place is a home located in Contra Costa County with nearby schools including Neil A. Armstrong Elementary School, Pine Valley Middle School, and California High School.
Ownership History
Date
Name
Owned For
Owner Type
Purchase Details
Closed on
Feb 19, 2013
Sold by
Srour Gus and Srour Razan V
Bought by
Plicner Matt and Plicner Jun Ma
Current Estimated Value
Home Financials for this Owner
Home Financials are based on the most recent Mortgage that was taken out on this home.
Original Mortgage
$414,500
Outstanding Balance
$289,088
Interest Rate
3.36%
Mortgage Type
New Conventional
Estimated Equity
$981,836
Purchase Details
Closed on
Apr 21, 2005
Sold by
Srour Razan V and Srour Gus
Bought by
Srour Gus and Srour Razan
Home Financials for this Owner
Home Financials are based on the most recent Mortgage that was taken out on this home.
Original Mortgage
$528,000
Interest Rate
5.89%
Mortgage Type
Purchase Money Mortgage
Purchase Details
Closed on
Jul 10, 2003
Sold by
Srour Gus Edward
Bought by
Srour Razan
Home Financials for this Owner
Home Financials are based on the most recent Mortgage that was taken out on this home.
Original Mortgage
$382,500
Interest Rate
5.22%
Mortgage Type
Stand Alone First
Purchase Details
Closed on
Jun 26, 2001
Sold by
Rynberg Kenneth L and Rynberg Cheryl A
Bought by
Nisbet Richard K and Nisbet Michelle A
Purchase Details
Closed on
Mar 30, 2001
Sold by
Srour Razan V
Bought by
Srour Gus Edward and Srour Razan
Home Financials for this Owner
Home Financials are based on the most recent Mortgage that was taken out on this home.
Original Mortgage
$415,000
Interest Rate
6.89%
Mortgage Type
Stand Alone First
Purchase Details
Closed on
Feb 20, 2001
Sold by
Srour Gus
Bought by
Srour Razan
Home Financials for this Owner
Home Financials are based on the most recent Mortgage that was taken out on this home.
Original Mortgage
$415,000
Interest Rate
6.89%
Mortgage Type
Stand Alone First
Purchase Details
Closed on
Jan 31, 2001
Sold by
Nisbet Richard K and Nisbet Michelle A
Bought by
Srour Razan
Home Financials for this Owner
Home Financials are based on the most recent Mortgage that was taken out on this home.
Original Mortgage
$415,000
Interest Rate
6.89%
Mortgage Type
Stand Alone First
Purchase Details
Closed on
Jul 8, 1998
Sold by
Rynberg Kenneth L and Rynberg Cheryl A
Bought by
Nisbet Richard K and Nisbet Michelle A
Purchase Details
Closed on
Jun 13, 1995
Sold by
Welzien Dirk
Bought by
Rynberg Kenneth L and Rynberg Cheryl A
Home Financials for this Owner
Home Financials are based on the most recent Mortgage that was taken out on this home.
Original Mortgage
$196,650
Interest Rate
8.37%
Mortgage Type
Purchase Money Mortgage
Create a Home Valuation Report for This Property
The Home Valuation Report is an in-depth analysis detailing your home's value as well as a comparison with similar homes in the area
Home Values in the Area
Average Home Value in this Area
Purchase History
| Date | Buyer | Sale Price | Title Company |
|---|---|---|---|
| Plicner Matt | $533,500 | First American Title Company | |
| Srour Gus | -- | First American Title | |
| Srour Razan | -- | Alliance Title Company | |
| Nisbet Richard K | -- | North American Title Co | |
| Srour Gus Edward | -- | -- | |
| Srour Razan | -- | Chicago Title Co | |
| Srour Razan | $415,000 | Chicago Title Co | |
| Nisbet Richard K | -- | Commonwealth Land Title Co | |
| Rynberg Kenneth L | $218,500 | Commonwealth Land Title Co | |
| Welzien Dirk | -- | Commonwealth Land Title Co |
Source: Public Records
Mortgage History
| Date | Status | Borrower | Loan Amount |
|---|---|---|---|
| Open | Plicner Matt | $414,500 | |
| Previous Owner | Srour Gus | $528,000 | |
| Previous Owner | Srour Razan | $382,500 | |
| Previous Owner | Srour Razan | $415,000 | |
| Previous Owner | Rynberg Kenneth L | $196,650 | |
| Closed | Srour Razan | $25,500 |
Source: Public Records
Tax History Compared to Growth
Tax History
| Year | Tax Paid | Tax Assessment Tax Assessment Total Assessment is a certain percentage of the fair market value that is determined by local assessors to be the total taxable value of land and additions on the property. | Land | Improvement |
|---|---|---|---|---|
| 2025 | $7,804 | $656,954 | $566,204 | $90,750 |
| 2024 | $7,676 | $644,073 | $555,102 | $88,971 |
| 2023 | $7,676 | $631,445 | $544,218 | $87,227 |
| 2022 | $7,622 | $619,065 | $533,548 | $85,517 |
| 2021 | $7,473 | $606,928 | $523,087 | $83,841 |
| 2019 | $7,319 | $588,928 | $507,573 | $81,355 |
| 2018 | $7,050 | $577,381 | $497,621 | $79,760 |
| 2017 | $6,796 | $566,061 | $487,864 | $78,197 |
| 2016 | $6,711 | $554,963 | $478,299 | $76,664 |
| 2015 | $6,648 | $546,628 | $471,115 | $75,513 |
| 2014 | $6,571 | $535,921 | $461,887 | $74,034 |
Source: Public Records
Map
Nearby Homes
- 25 Marilyn Place
- 14 Poppy Hills Ln
- 10 Almond Orchard Ln
- 4 Henry Ranch Dr
- 74 Hazelnut Ct
- 740 Sutter Creek Ln Unit 740
- 434 Devon Ct
- 9832 Del Mar Dr
- 3217 Ensenada Dr
- 820 Pinehurst Place
- 3163 Christopher Way
- 7472 Blue Fox Way
- 10013 Foxboro Cir
- 10034 Foxboro Cir
- 54 Madrid Place
- 6 San Pedro Place
- 341 Santa Cruz Place
- 7510 Corrinne St
- 2740 Mohawk Cir
- 9085 Alcosta Blvd Unit 374
- 12 Marilyn Place
- 20 Marilyn Place
- 9736 Tareyton Ave
- 9734 Tareyton Ave
- 9738 Tareyton Ave
- 24 Marilyn Place
- 9732 Tareyton Ave
- 11 Marilyn Place
- 17 Marilyn Place
- 2811 Springdale Ln
- 21 Marilyn Place
- 2807 Springdale Ln
- 2815 Springdale Ln
- 2820 Springdale Ln
- 2803 Springdale Ln
- 2819 Springdale Ln
- 9741 Davona Dr
- 9737 Davona Dr
- 72 Randolph Place
- 2823 Springdale Ln