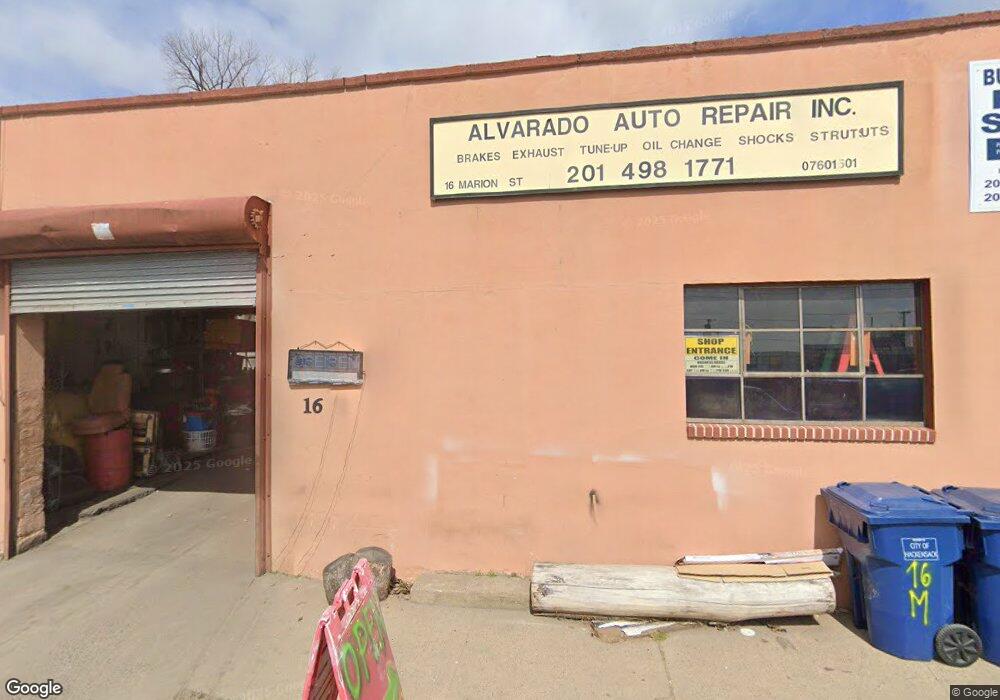
16 Marion St Hackensack, NJ 07601
Estimated Value: $769,857
Studio
--
Bath
5,612
Sq Ft
$137/Sq Ft
Est. Value
About This Home
This home is located at 16 Marion St, Hackensack, NJ 07601 and is currently priced at $769,857, approximately $137 per square foot. 16 Marion St is a home located in Bergen County with nearby schools including Hackensack High School and George Washington School.
Ownership History
Date
Name
Owned For
Owner Type
Purchase Details
Closed on
Jul 22, 2022
Sold by
S & H Realty Associates Llc
Bought by
Marion One Llc
Current Estimated Value
Purchase Details
Closed on
Aug 21, 1996
Sold by
Scugoza Thomas F
Bought by
S & H Realty Assoc Llc
Home Financials for this Owner
Home Financials are based on the most recent Mortgage that was taken out on this home.
Original Mortgage
$126,000
Interest Rate
7.89%
Mortgage Type
Commercial
Create a Home Valuation Report for This Property
The Home Valuation Report is an in-depth analysis detailing your home's value as well as a comparison with similar homes in the area
Home Values in the Area
Average Home Value in this Area
Purchase History
| Date | Buyer | Sale Price | Title Company |
|---|---|---|---|
| Marion One Llc | $655,000 | New Jersey Land Title | |
| Marion One Llc | $655,000 | New Jersey Land Title | |
| S & H Realty Assoc Llc | $79,000 | -- |
Source: Public Records
Mortgage History
| Date | Status | Borrower | Loan Amount |
|---|---|---|---|
| Previous Owner | S & H Realty Assoc Llc | $126,000 |
Source: Public Records
Tax History
| Year | Tax Paid | Tax Assessment Tax Assessment Total Assessment is a certain percentage of the fair market value that is determined by local assessors to be the total taxable value of land and additions on the property. | Land | Improvement |
|---|---|---|---|---|
| 2025 | $21,591 | $706,500 | $367,700 | $338,800 |
| 2024 | $20,340 | $706,500 | $367,700 | $338,800 |
| 2023 | $20,239 | $706,500 | $367,700 | $338,800 |
| 2022 | $20,239 | $722,300 | $367,700 | $354,600 |
| 2021 | $19,392 | $577,500 | $245,100 | $332,400 |
| 2020 | $19,109 | $577,500 | $245,100 | $332,400 |
| 2019 | $24,835 | $739,800 | $245,100 | $494,700 |
| 2018 | $22,277 | $652,700 | $245,100 | $407,600 |
| 2017 | $19,226 | $563,000 | $245,100 | $317,900 |
| 2016 | $15,850 | $469,200 | $245,100 | $224,100 |
| 2015 | $13,748 | $392,800 | $257,000 | $135,800 |
| 2014 | $13,049 | $392,800 | $257,000 | $135,800 |
Source: Public Records
Map
Nearby Homes
- 84 Kansas St
- 99 Kansas St
- 113 Kansas St
- 115 Kansas St
- 115 River Rd
- 337 Hudson St
- 75 Cleveland St
- 9 Vreeland Ave Unit 3A
- 65 Mcdougall Ln
- 235 Larch Ave
- 39 Union St Unit 105
- 74 Union St
- 75 Union St Unit 5E
- 418 Taylor Ave
- 72 Lawrence St
- 313 Elm Ave
- 228 Ridgefield Ave
- 79 Beechwood Ave
- 467 Hudson St
- 414 Larch Ave
Your Personal Tour Guide
Ask me questions while you tour the home.