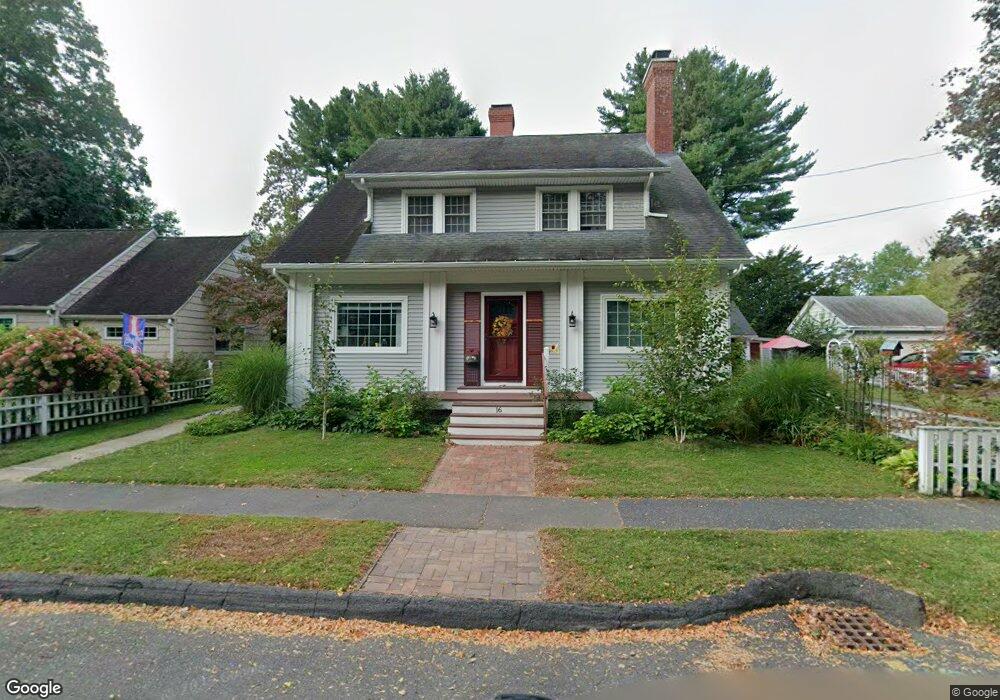
16 Marshall St Northampton, MA 01060
Estimated Value: $655,000 - $840,000
3
Beds
2
Baths
2,606
Sq Ft
$277/Sq Ft
Est. Value
About This Home
This home is located at 16 Marshall St, Northampton, MA 01060 and is currently estimated at $722,968, approximately $277 per square foot. 16 Marshall St is a home located in Hampshire County with nearby schools including Northampton High School, The Montessori School of Northampton, and Campus School of Smith College.
Ownership History
Date
Name
Owned For
Owner Type
Purchase Details
Closed on
May 20, 2024
Sold by
Moos Stephen E and Moos Sheila N
Bought by
Stephe & Sheila Moos Ft and Moos
Current Estimated Value
Purchase Details
Closed on
Jan 1, 1976
Bought by
Moos Stephen E and Moos Sheila N
Create a Home Valuation Report for This Property
The Home Valuation Report is an in-depth analysis detailing your home's value as well as a comparison with similar homes in the area
Home Values in the Area
Average Home Value in this Area
Purchase History
| Date | Buyer | Sale Price | Title Company |
|---|---|---|---|
| Stephe & Sheila Moos Ft | -- | None Available | |
| Stephe & Sheila Moos Ft | -- | None Available | |
| Moos Stephen E | $32,500 | -- |
Source: Public Records
Mortgage History
| Date | Status | Borrower | Loan Amount |
|---|---|---|---|
| Previous Owner | Moos Stephen E | $336,000 | |
| Previous Owner | Moos Stephen E | $40,000 | |
| Previous Owner | Moos Stephen E | $236,000 |
Source: Public Records
Tax History Compared to Growth
Tax History
| Year | Tax Paid | Tax Assessment Tax Assessment Total Assessment is a certain percentage of the fair market value that is determined by local assessors to be the total taxable value of land and additions on the property. | Land | Improvement |
|---|---|---|---|---|
| 2025 | $9,034 | $648,500 | $148,300 | $500,200 |
| 2024 | $8,989 | $591,800 | $170,000 | $421,800 |
| 2023 | $8,820 | $556,800 | $154,500 | $402,300 |
| 2022 | $7,950 | $444,400 | $144,400 | $300,000 |
| 2021 | $7,424 | $427,400 | $137,500 | $289,900 |
| 2020 | $7,180 | $427,400 | $137,500 | $289,900 |
| 2019 | $7,141 | $411,100 | $137,500 | $273,600 |
| 2018 | $7,024 | $412,200 | $137,500 | $274,700 |
| 2017 | $6,880 | $412,200 | $137,500 | $274,700 |
| 2016 | $6,661 | $412,200 | $137,500 | $274,700 |
| 2015 | $6,374 | $403,400 | $130,000 | $273,400 |
| 2014 | $6,208 | $403,400 | $130,000 | $273,400 |
Source: Public Records
Map
Nearby Homes
- 59 Day Ave
- 41 Old Ferry Rd
- 8 View Ave Unit A
- 8 View Ave Unit B
- 50 Walnut St
- 30 Cherry St
- 30 Cherry St Unit A
- 30 Cherry St Unit B
- 9 Walnut St Unit B
- 13 1/2 Finn St
- 30 Graves Ave Unit B
- 58 Phillips Place
- 215 State St
- 26 Russell St Unit A-B
- 37 Finn St
- 51 Phillips Place Unit 1
- 5 Prospect Ct
- 36 Butler Place
- 74 Barrett St Unit 105
- 79 Aqua Vitae Rd